Introduction
Meloki is a local AI platform running on scope7-hardware, designed specifically for customers, it offers easy access to powerful AI solutions. This documentation describes the features of the meloki AdminPACK.
The meloki software and AI solutions are installed on the primary NVMe drive. An additional drive is also available; while used for backups by default, it can also be utilized to store input and output data (such as RAG files, audio files, or custom models).
This document assumes that you have already set up your meloki system using our Quick Start Guide.
meloki Login
The admin panel requires an authenticated user.
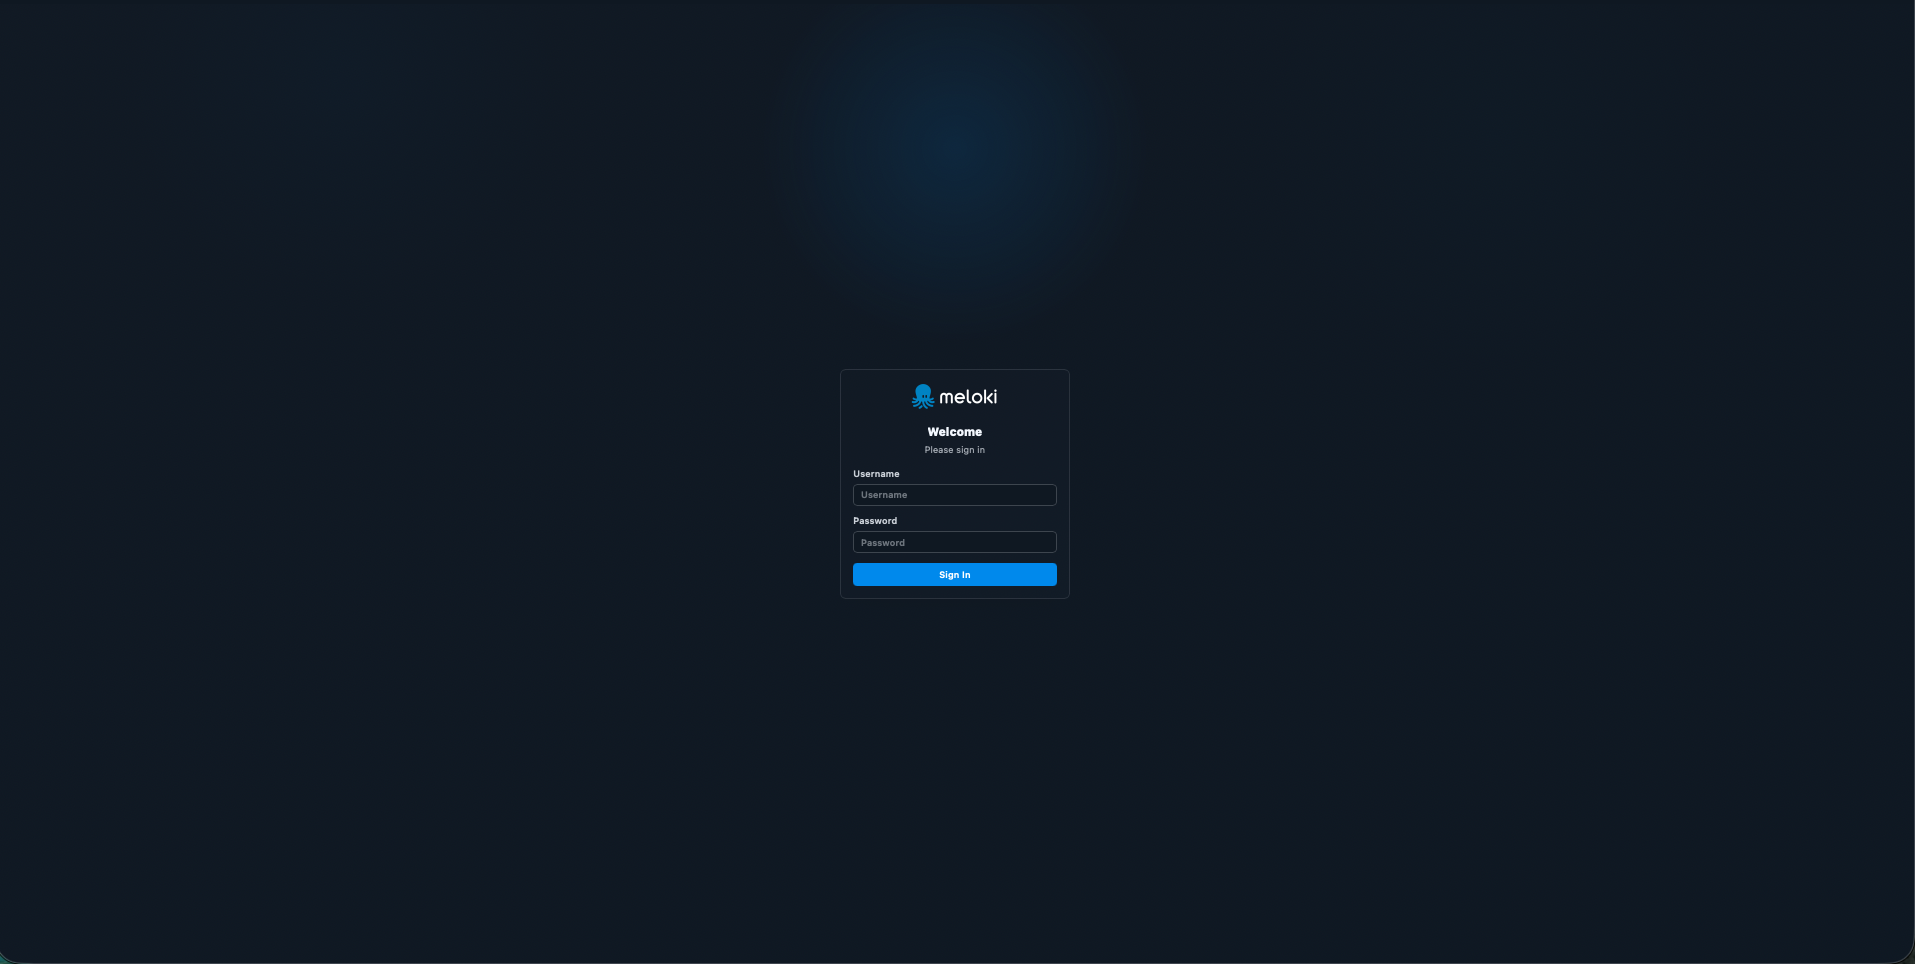 Log in using the following default credentials:
Username: meloki
Password: meloki
meloki Admin Panel
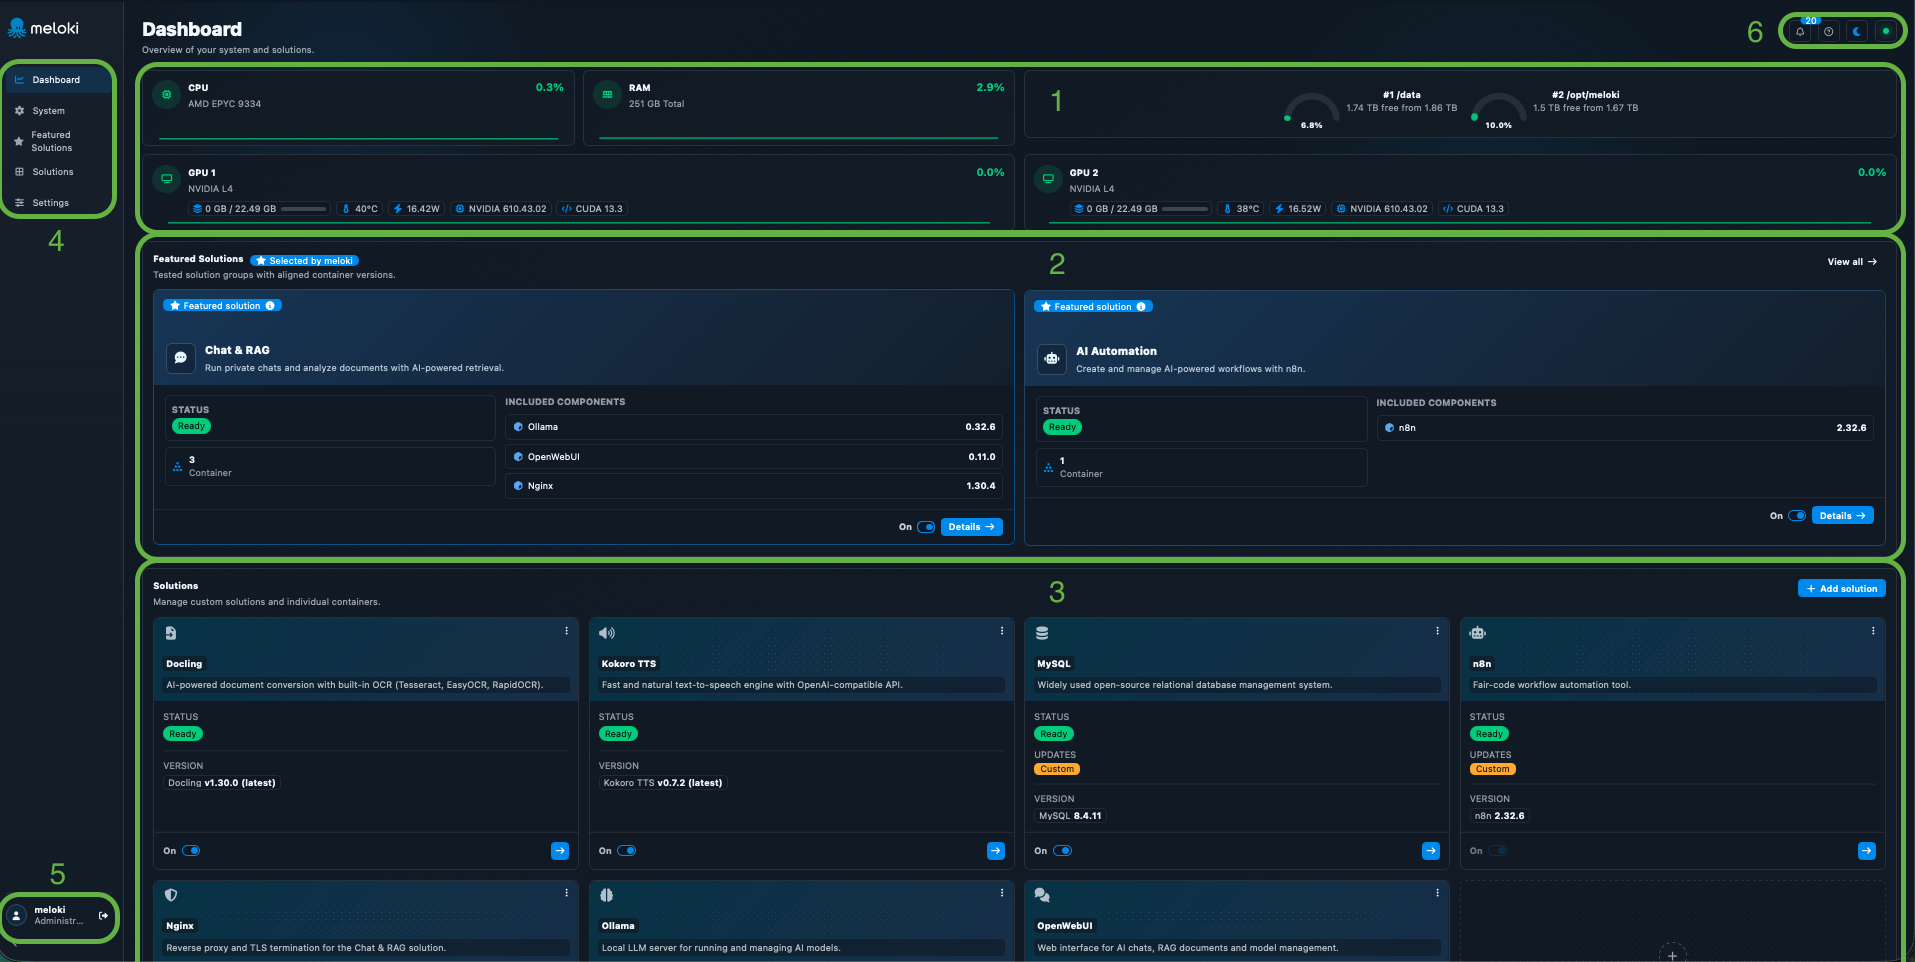
The dashboard provides a compact overview of the current system status, installed solutions, and key administrative functions.
1. System Resources
This section displays the current status of key hardware resources.
These include:
- CPU and RAM usage
- Storage usage
- GPU usage
- GPU memory and temperature
- Power consumption
- Driver and CUDA versions
This allows for a quick check of current system load.
2. Featured Solutions
This section displays solutions selected and pre-configured by meloki.
Displayed information includes:
- Solution status
- Number of containers
- Included components
- Component versions
- Activation status
Clicking "Details" allows you to view further information about a specific solution.
3. Solutions
This area displays the installed applications and containers.
For each solution, the following information is shown (for example):
- Name and description
- Current status
- Installed version
- Available updates
- Activation status
Individual solutions can be managed, activated, or deactivated here. Additional applications can be added via "Add Solution".
4. Navigation
The navigation menu on the left allows you to access the platform's various sections:
- Dashboard
- System
- Featured Solutions
- Solutions
- Settings
This enables quick switching between the different management areas.
5. User Area
The currently logged-in user is displayed at the bottom of the navigation menu.
This area provides access to user-specific functions and settings.
6. Quick Access and Notifications
Various global quick-access options and status functions are located in the top right corner.
These include, for example:
- Notifications
- Status information
- Additional quick-access options
- Display/color scheme toggles
These functions are available regardless of the section currently open.
System Overview
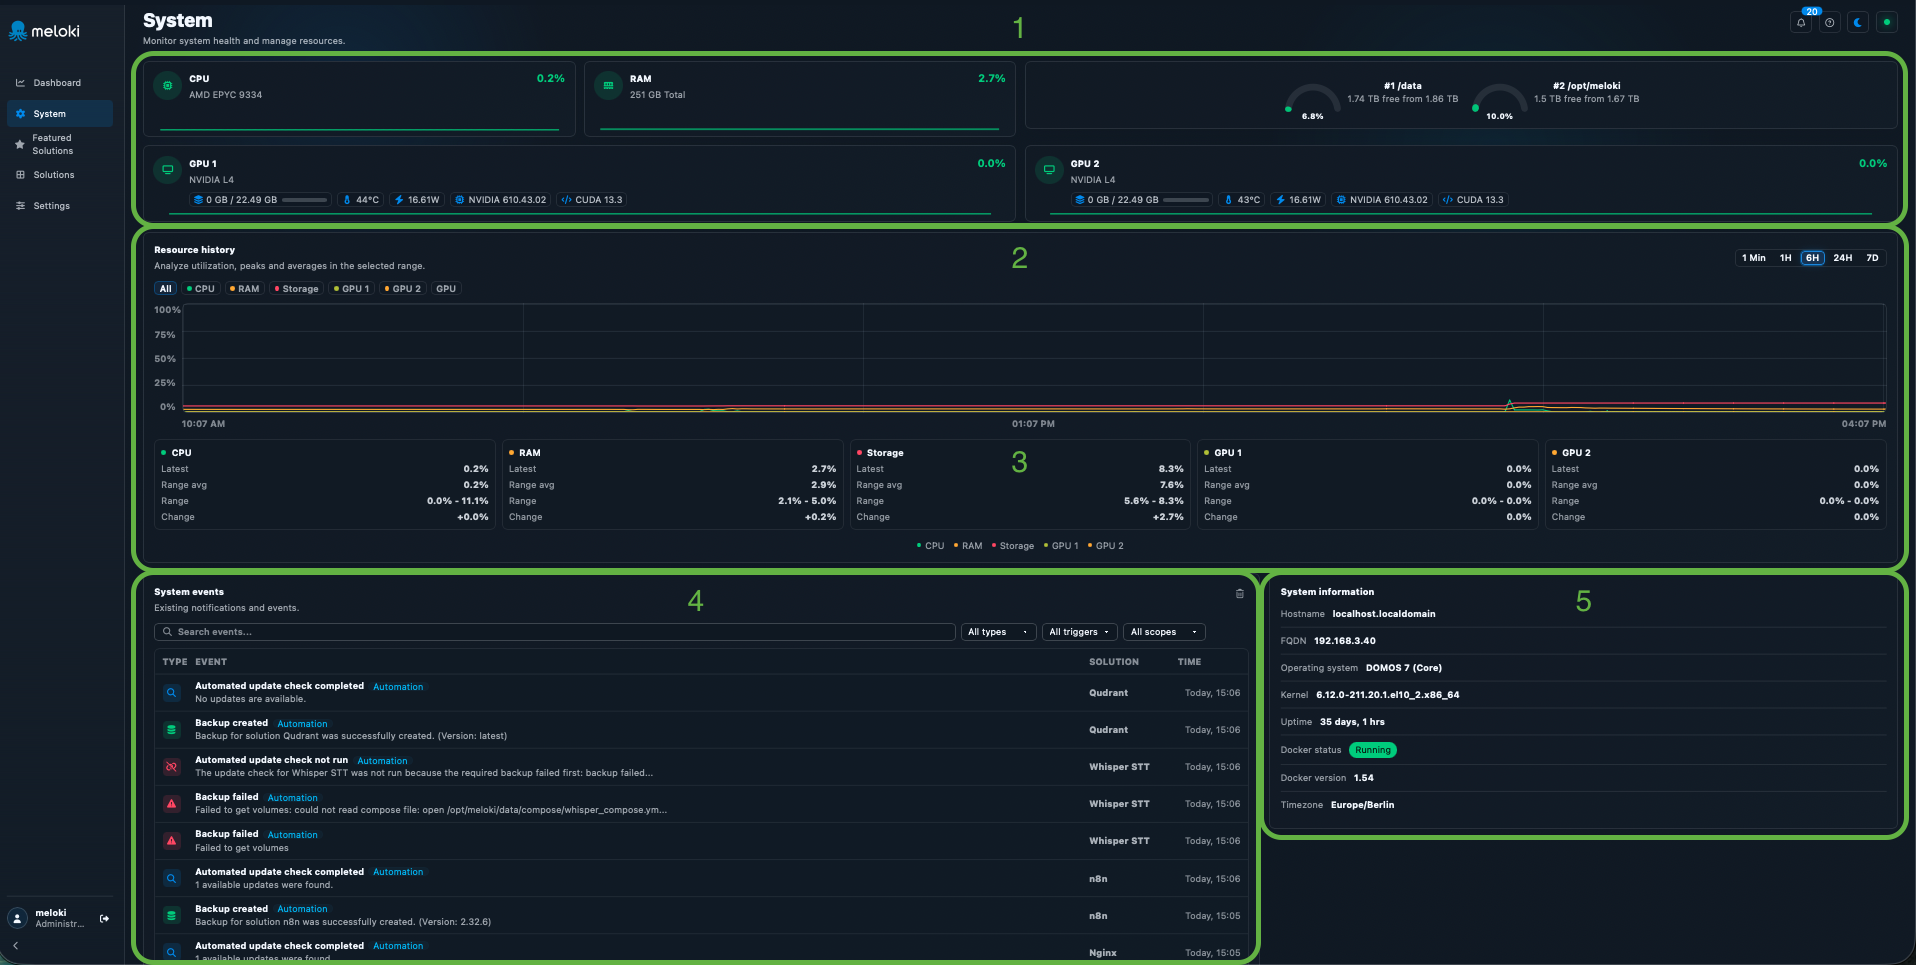
The "System" page provides a central overview of the server's current status. Here, you can monitor key hardware resources, analyze their utilization over a specific period, and view system events and basic system information.
The view is divided into several sections, marked in the screenshot by green indicators numbered 1 through 5.
1. Current System Status
The top section displays the system's key hardware resources in a compact format.
Information available here includes:
-
CPU
- Processor in use
- Current CPU utilization
-
RAM
- Total available system memory
- Current RAM utilization
-
Storage
- Usage of existing drives or partitions
- Free and total available storage space
- Storage utilization percentage
-
GPU 1 and GPU 2
- Installed graphics card
- Current GPU utilization
- Used and available video memory (VRAM)
- Current temperature
- Power consumption
- Installed NVIDIA driver version
- CUDA version in use
This section is ideal for a quick overview of whether the hardware is operating normally or if a specific resource is currently under heavy load.
2. Resource History
The "Resource History" section provides a graphical representation of system utilization over a specific period.
The chart makes it easier to identify changes and utilization spikes. You can view different resources either individually or simultaneously.
Available resources include:
- CPU
- RAM
- Storage
- GPU 1
- GPU 2
Individual resources can be shown or hidden using the selection options above the chart.
Additionally, the time range displayed can be adjusted. In the example shown, the following timeframes are available:
- 1 minute
- 1 hour
- 6 hours
- 24 hours
- 7 days
This makes it possible, for example, to determine whether high utilization occurred only briefly or persisted over a longer period.
3. Resource Statistics
Below the trend chart, the metrics for each resource are summarized as statistics.
For each resource, the following values (among others) are displayed:
-
Latest Value
The most recently measured utilization. -
Period Avg.
The average utilization within the selected time period. -
Range
The lowest and highest measured values within the time period. -
Change
The change in resource utilization within the observed time period.
This overview complements the chart with concrete numerical values, thereby facilitating a more precise assessment of system utilization.
4. System Events
The "System Events" section logs important actions, status changes, and system error messages.
Here, you can track the operations that have recently taken place on the system.
Possible events include, for example:
- a solution was started
- a solution was stopped
- a solution was restarted
- an action failed
- a solution failed to start
Additional information is displayed for each event, such as:
- Event type or status
- Description
- Affected solution
- Time of the event
Search and Filter
The event list can be searched and filtered.
Filters are available for the following categories, among others:
- Event type
- Trigger
- Affected area
This allows you to display, for instance, only error messages or events related to a specific solution.
Page Navigation
If there is a large number of events, they are distributed across multiple pages. You can switch between pages using the navigation controls at the bottom.
This section is particularly useful for troubleshooting and tracking system actions.
5. System Information
The "System Information" section displays basic technical details about the server and the system environment currently in use.
The example shown displays the following information, among other details:
- Hostname
- FQDN
- Operating system
- Kernel version
- System uptime
- Docker status
- Docker version
- Time zone
This information allows for a quick check of the system on which the application is running and the basic software components being used.
Of particular relevance here, for instance, are the current Docker status and the server uptime.
Featured Solutions
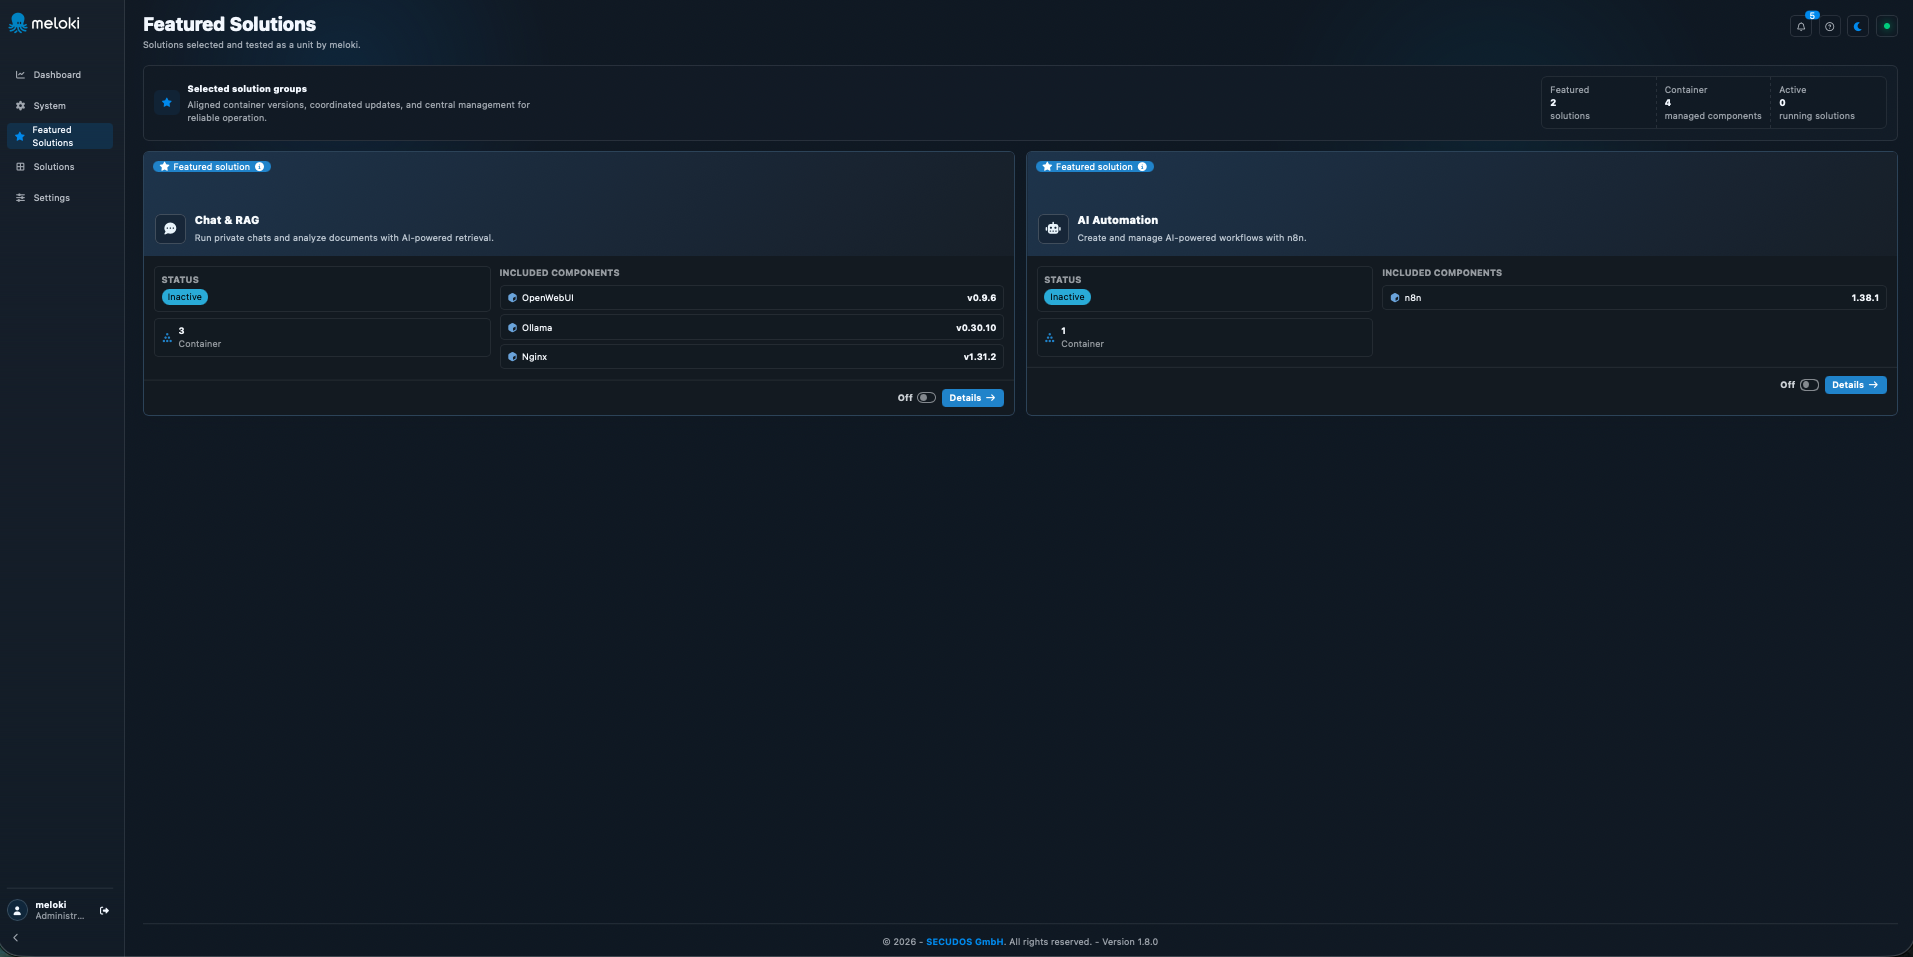
You can manage our Meloki solution suites via the Featured Solutions tab.
Here, you can activate or deactivate the entire solution suite, or switch to container management via Details.
Featured Solution – Detailed Overview
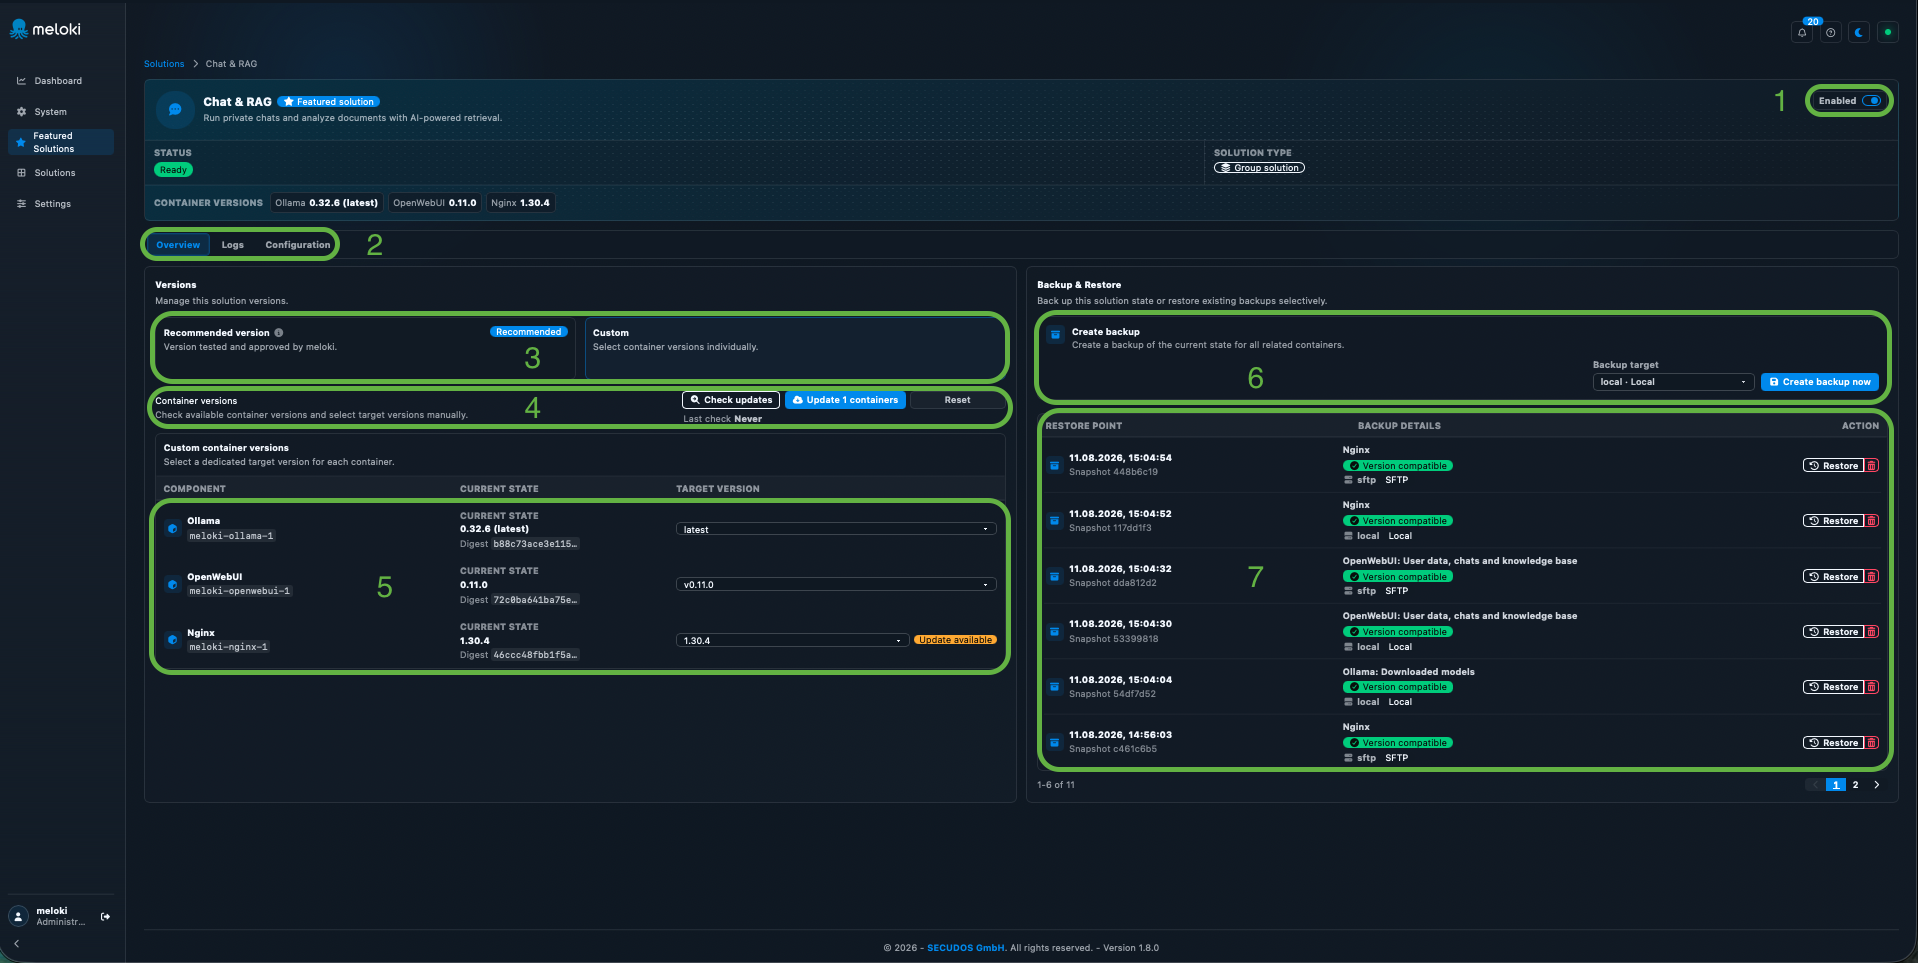
The detailed view of a Featured Solution allows for the management of the solution, its container versions, and the associated backups.
1. Activate / Deactivate Solution
The entire solution can be activated or deactivated using the toggle switch.
2. Navigation
Use the tabs to switch between different areas:
- Overview – Manage versions, updates, and backups
- Logs – View solution logs and messages
- Configuration – Adjust solution settings
3. Version Selection
Define how the solution's versions are managed here:
- Recommended Version – Versions tested and approved by meloki
- Custom – Manually select container versions
4. Updates
Check for available updates in this area.
You can then install available updates or revert changes.
5. Container Versions
This section displays all containers and their versions associated with the solution.
For each container, you can:
- view current versions
- select target versions
- detect available updates
6. Create Backup
Create a backup of the solution's current state here.
You can also select the desired backup destination.
7. Restore Backups
Existing restore points are listed here.
View information such as timestamp, content, and compatibility for a backup. You can then restore or delete the backup.
Solution Logs
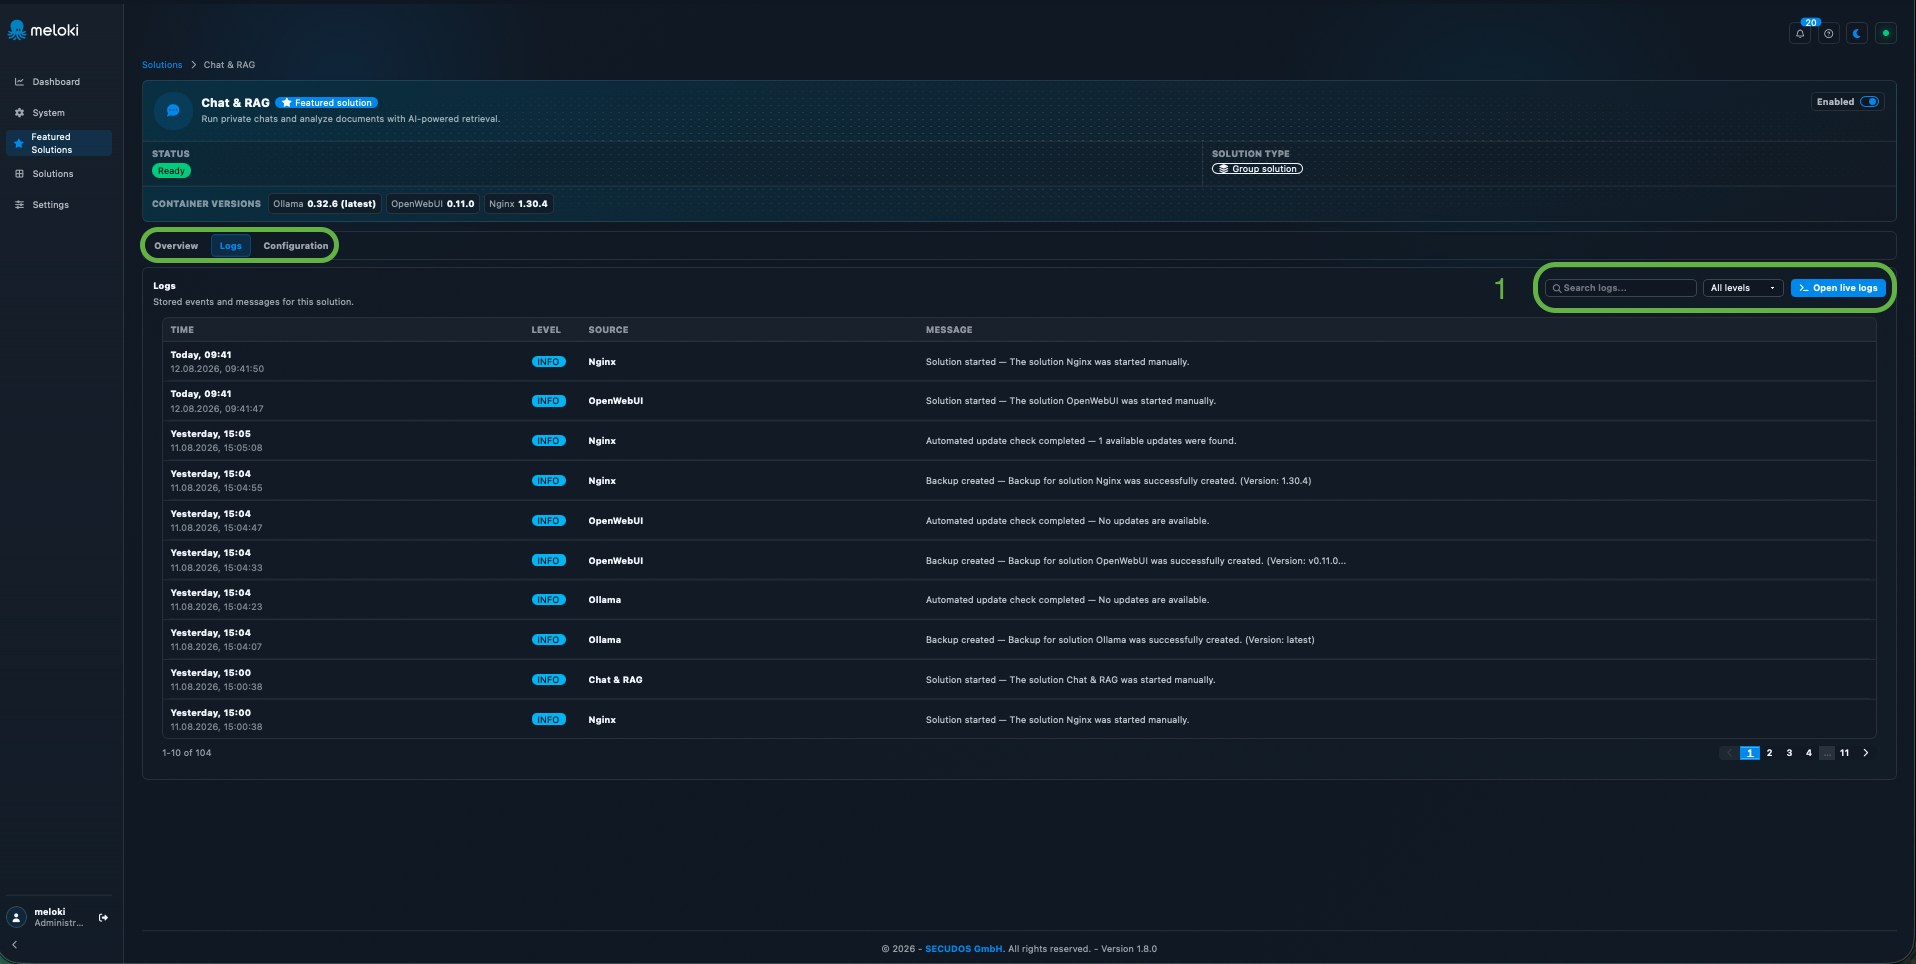
The Logs section displays stored events and messages for the selected solution.
Log Management
Logs can be:
- searched
- filtered by log level
- opened as live logs
The table displays the timestamp, level, source, and the corresponding message.
Configuration
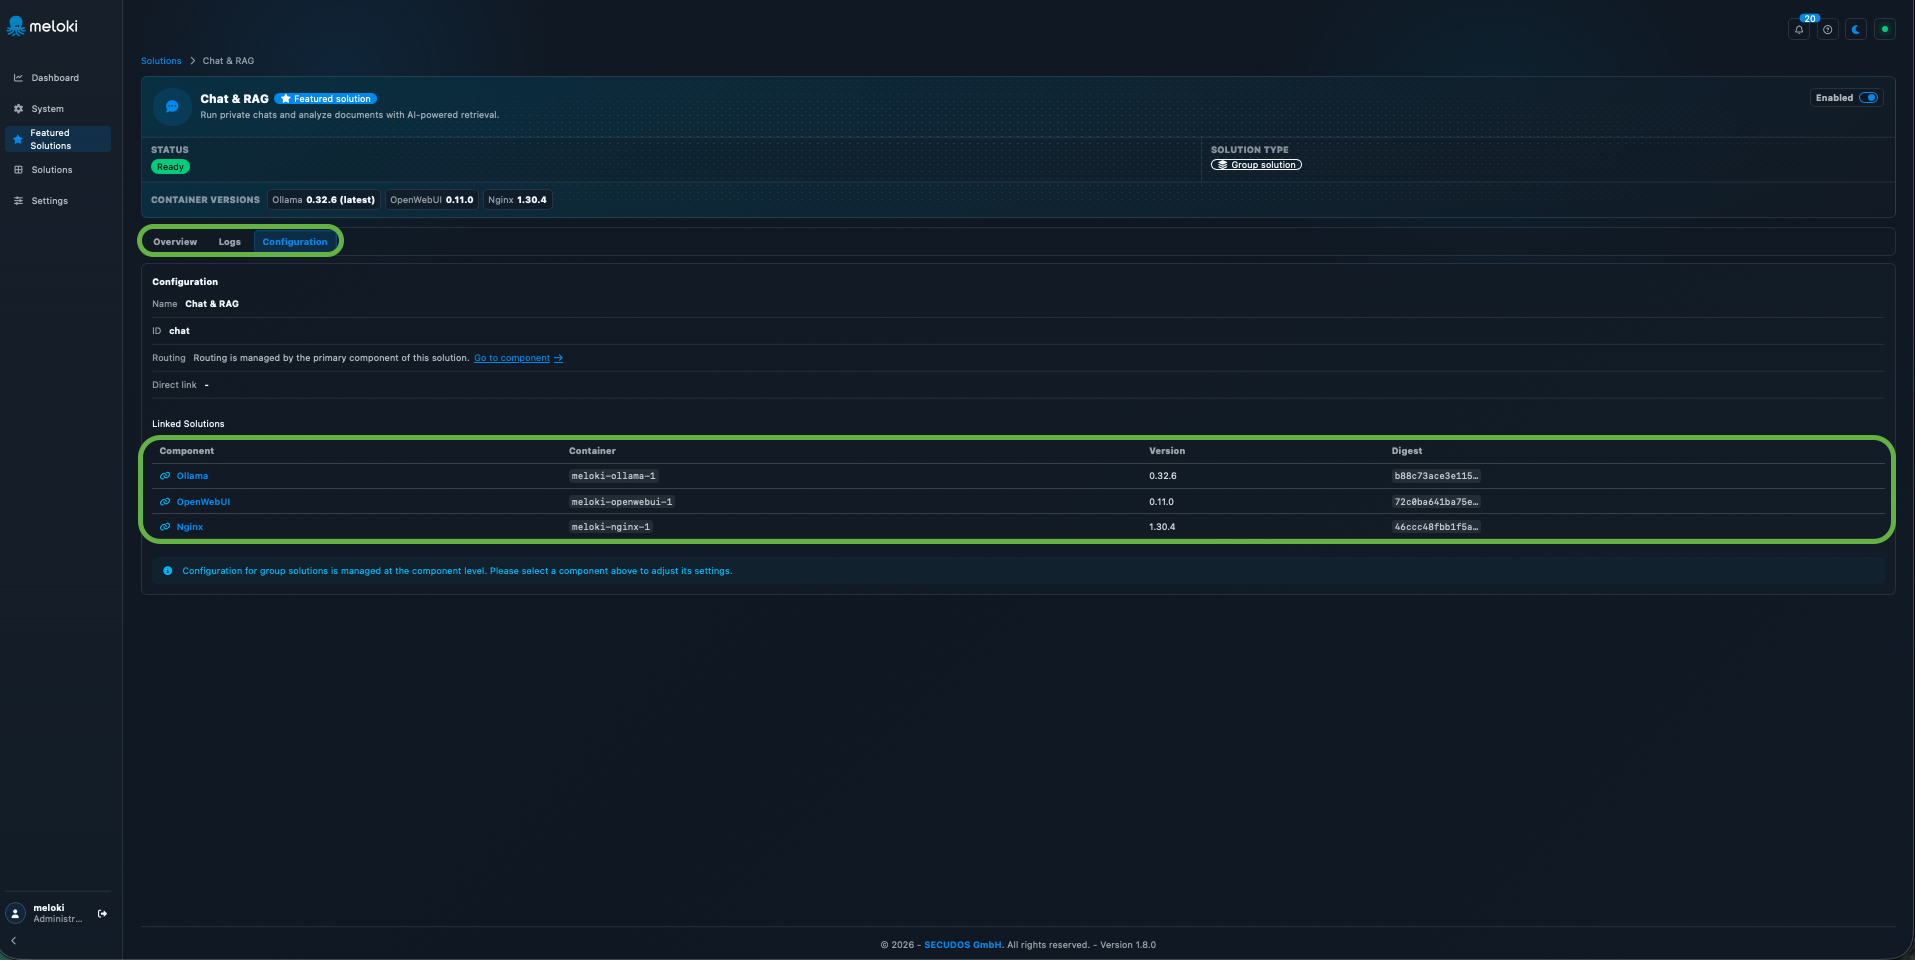
The Configuration section displays the basic settings and structure of the selected Featured Solution.
Configuration Overview
General information about the solution is displayed here, including:
- Solution name and ID
- Routing and forwarding
- Available direct link
Connected Solutions
The "Connected Solutions" section lists all the components that make up the solution.
The following information is visible for each component:
- Component and associated container
- Currently used version
- Container version digest
You can access and adjust the associated settings and templates via the respective component.
Solutions
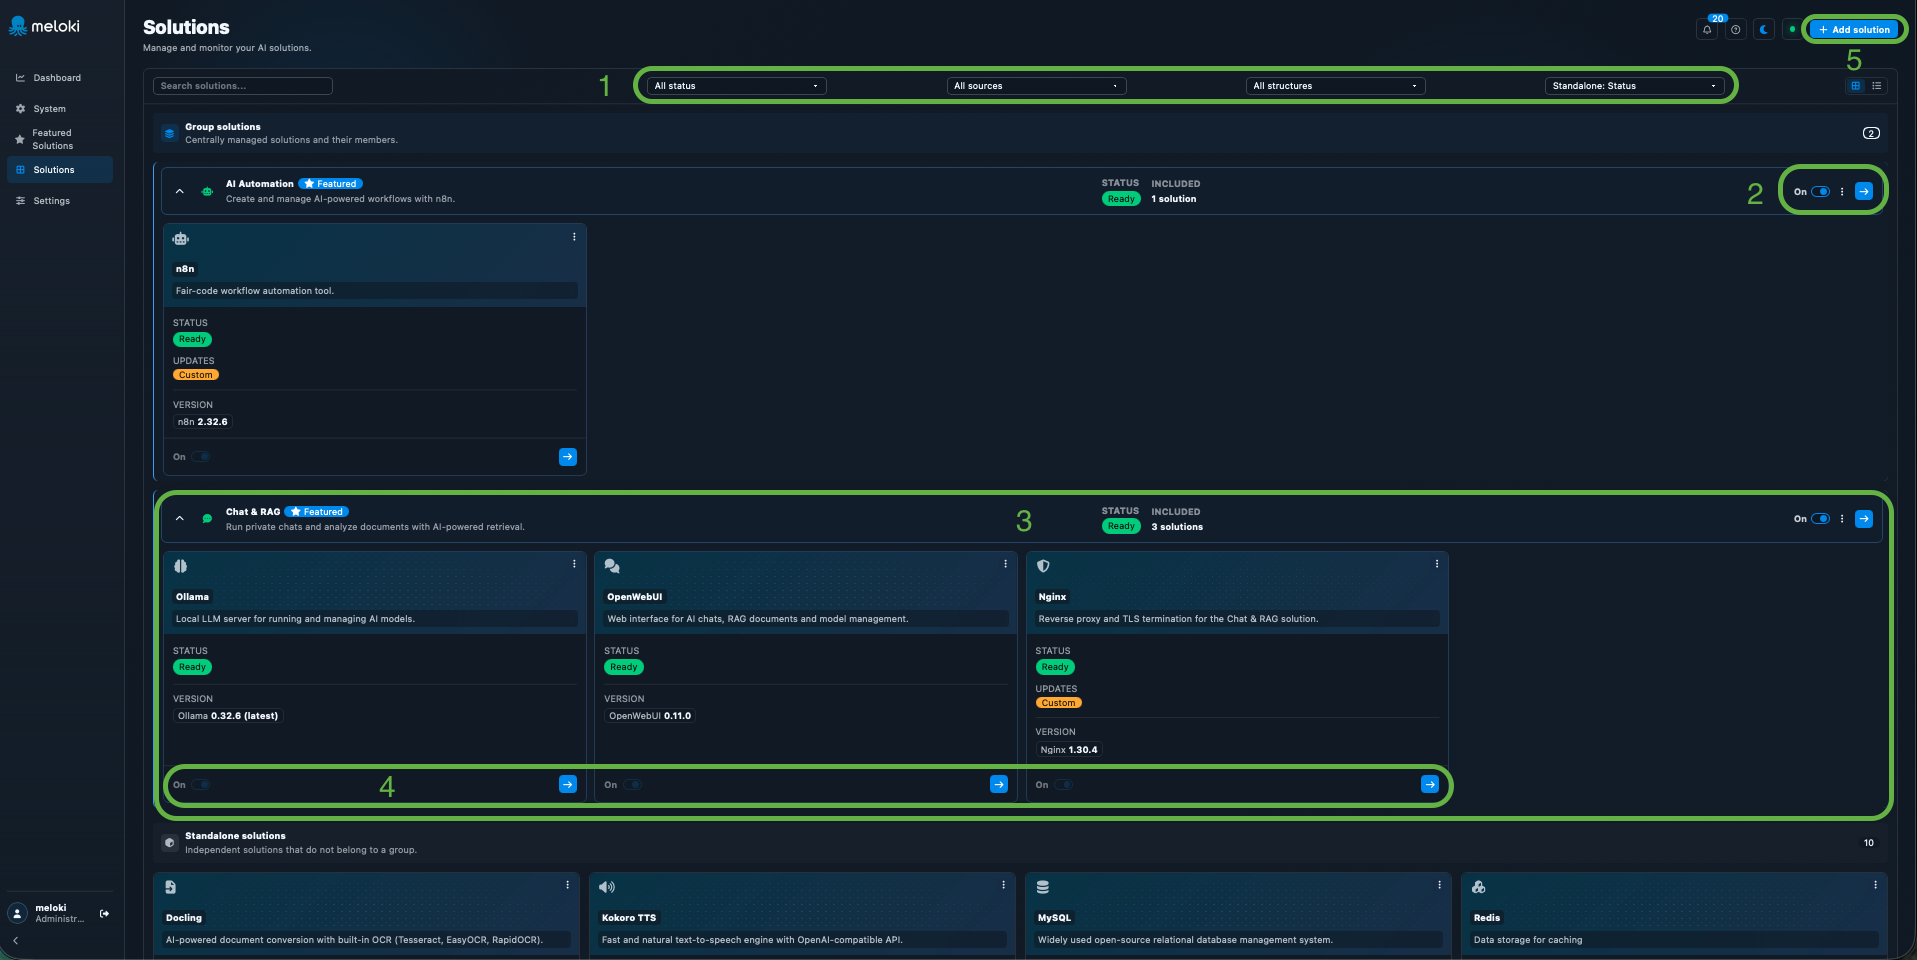
The Solutions section is used to manage all installed AI solutions and solution suites.
1. Search and filter
Existing solutions can be searched and filtered based on various criteria, such as:
- Status
- Source
- Structure
- Status of individual solutions
2. Manage solution suite
An entire solution suite can be activated or deactivated as a whole. Additionally, other actions can be triggered, or the detailed view can be opened.
3. Included solutions
The associated components within a solution suite are displayed here.
The following information is visible, among other details:
- Status
- Version
- Available updates
- Number of included solutions
4. Manage individual components
The components of a solution suite can be activated or deactivated individually. The respective detailed view can be opened using the arrow.
5. Add solution
Use "Add solution" to add further solutions to the system and subsequently manage them.
Standalone Solutions
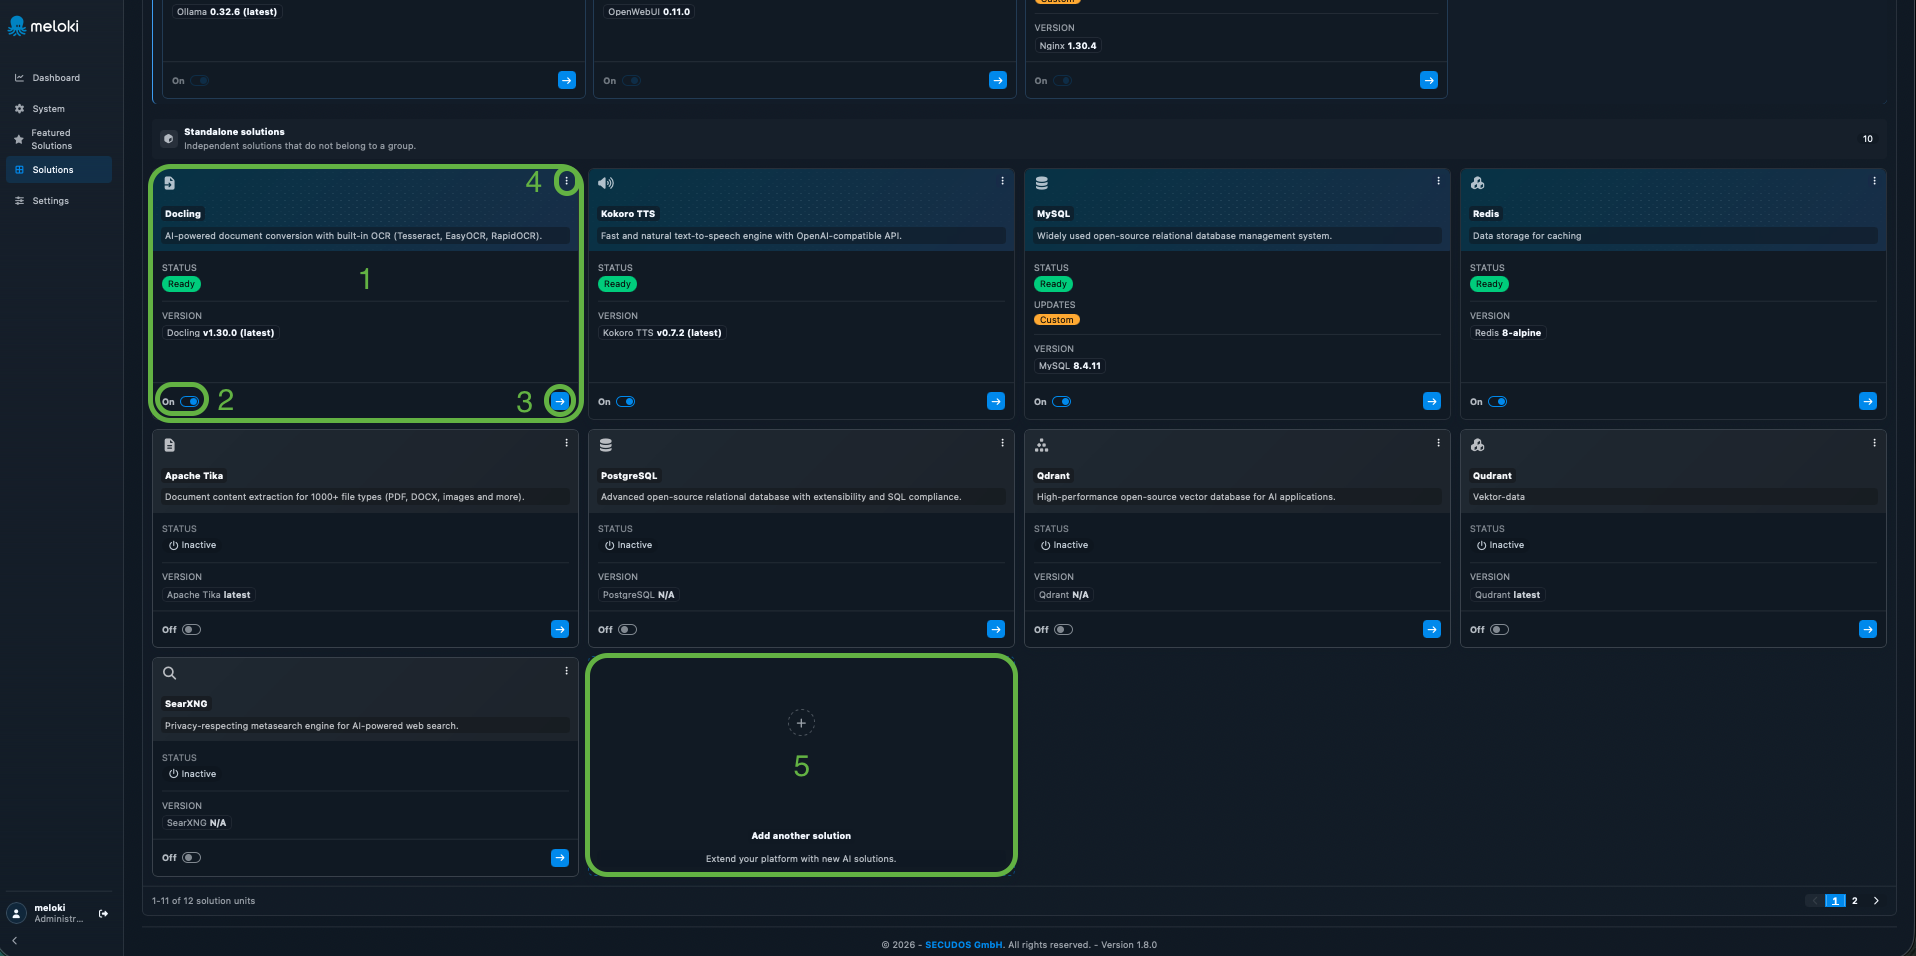
All standalone solutions are displayed and managed here.
1. Status and Version
Displays the current status and the installed version of the solution.
2. Activate / Deactivate
The respective solution can be enabled or disabled directly.
3. Details
Opens the detailed view of the selected solution.
4. Additional Actions
Additional actions for the solution can be accessed via the menu.
5. Add Solution
Additional solutions can be added to the system using this tile.
Select type
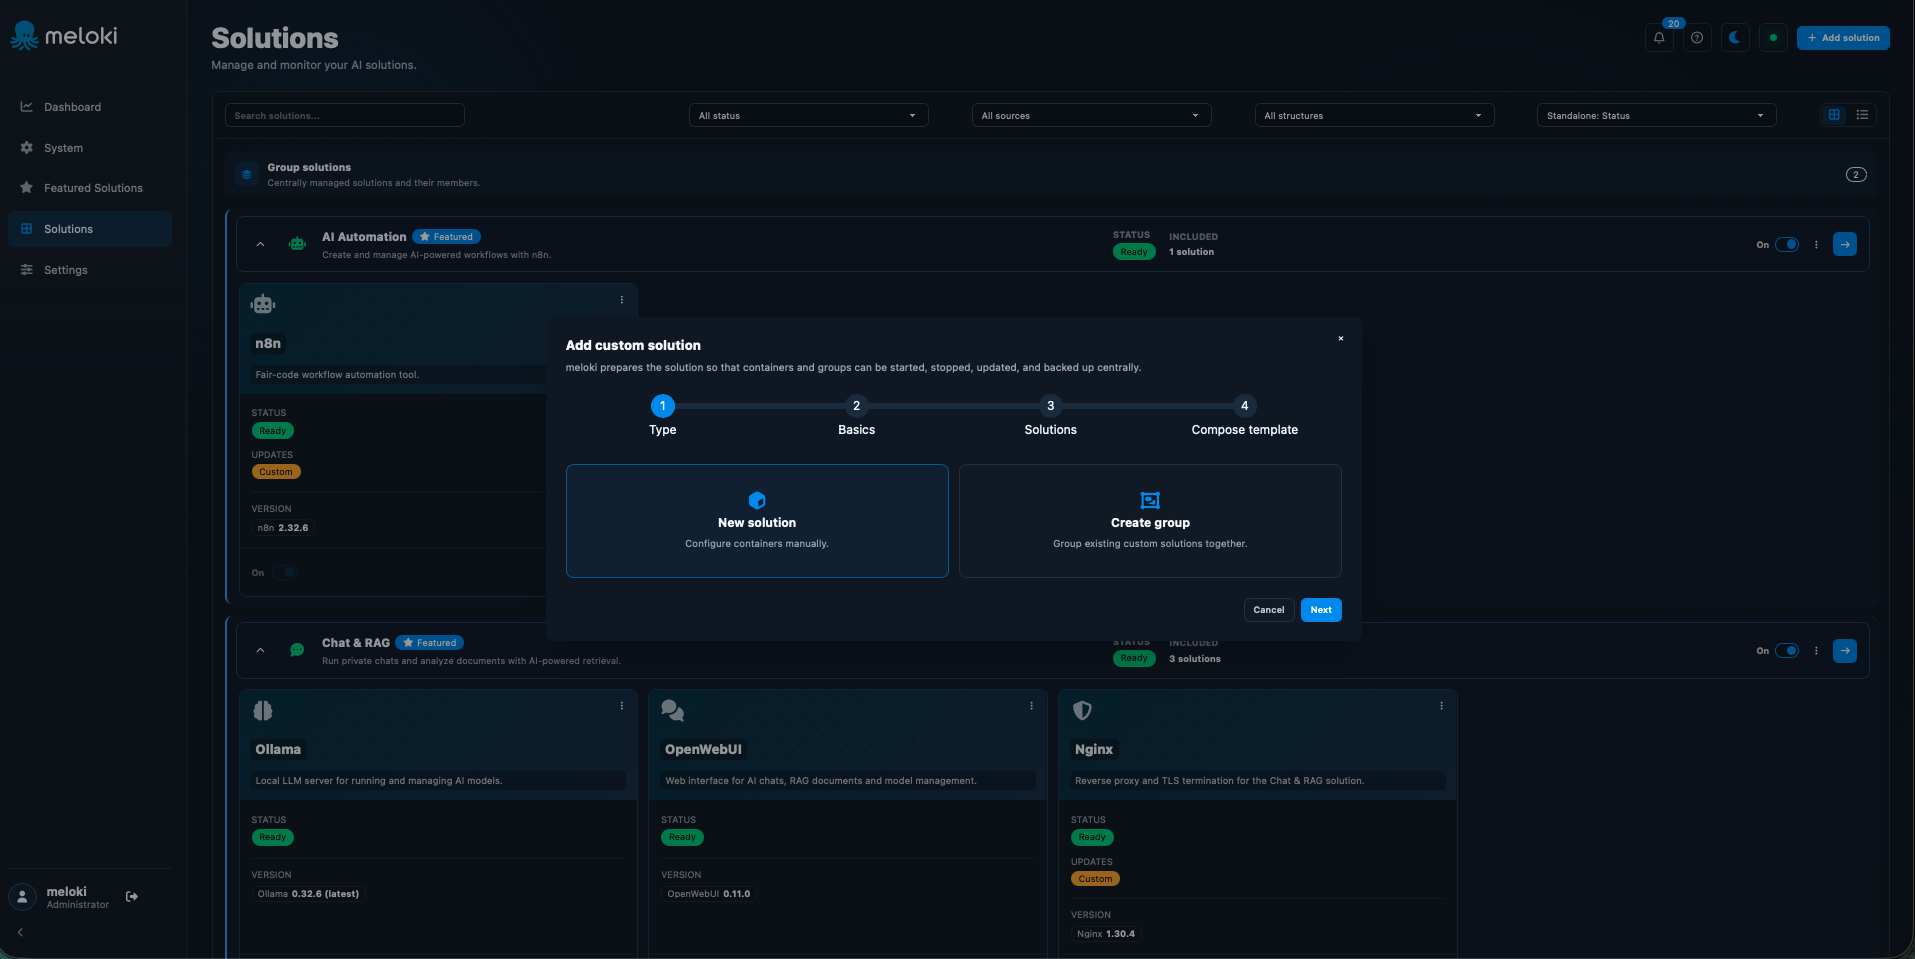
The first step is to determine the type of solution to be created.
The options are:
- New solution – manually configure a new container.
- Create group – combine multiple existing solutions into a unified solution group.
After making a selection, proceed by clicking "Next".
Basic data
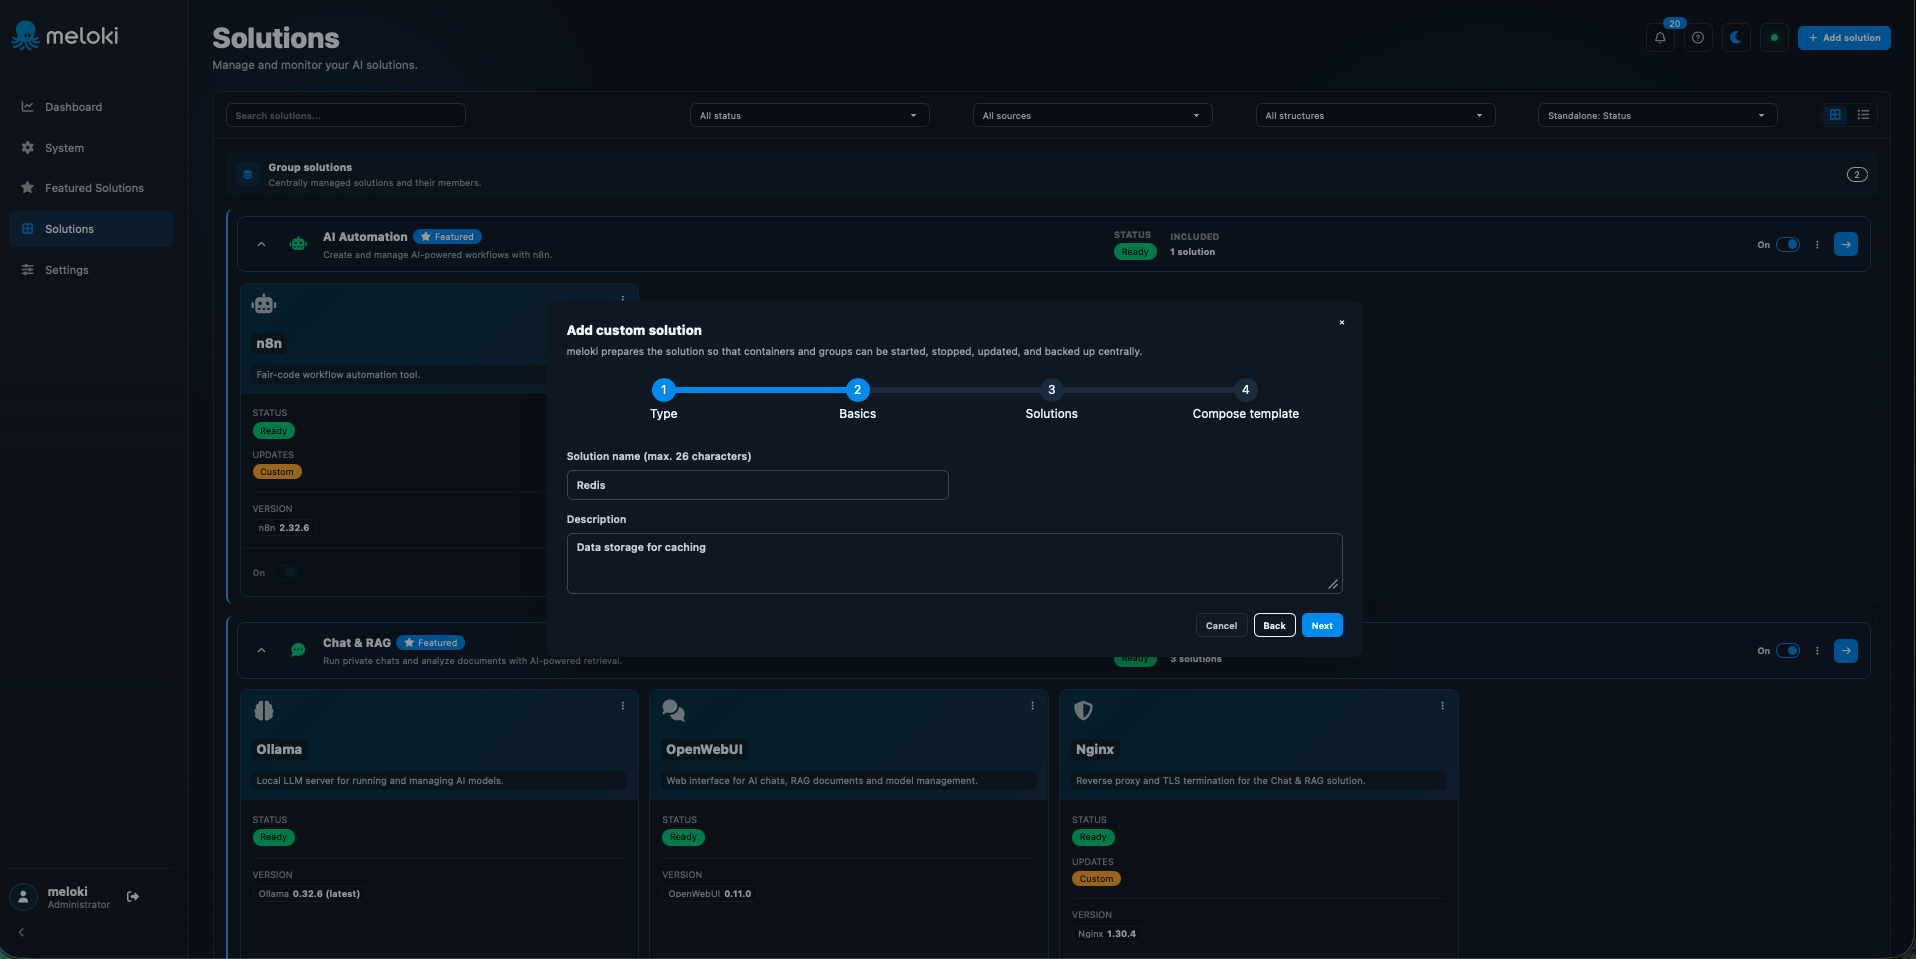
In the second step, the basic information for the new solution is defined.
This includes:
- Solution name – unique display name of the solution.
- Description – brief description of the intended use.
You can then proceed to the actual container configuration by clicking "Next".
Configuring the container
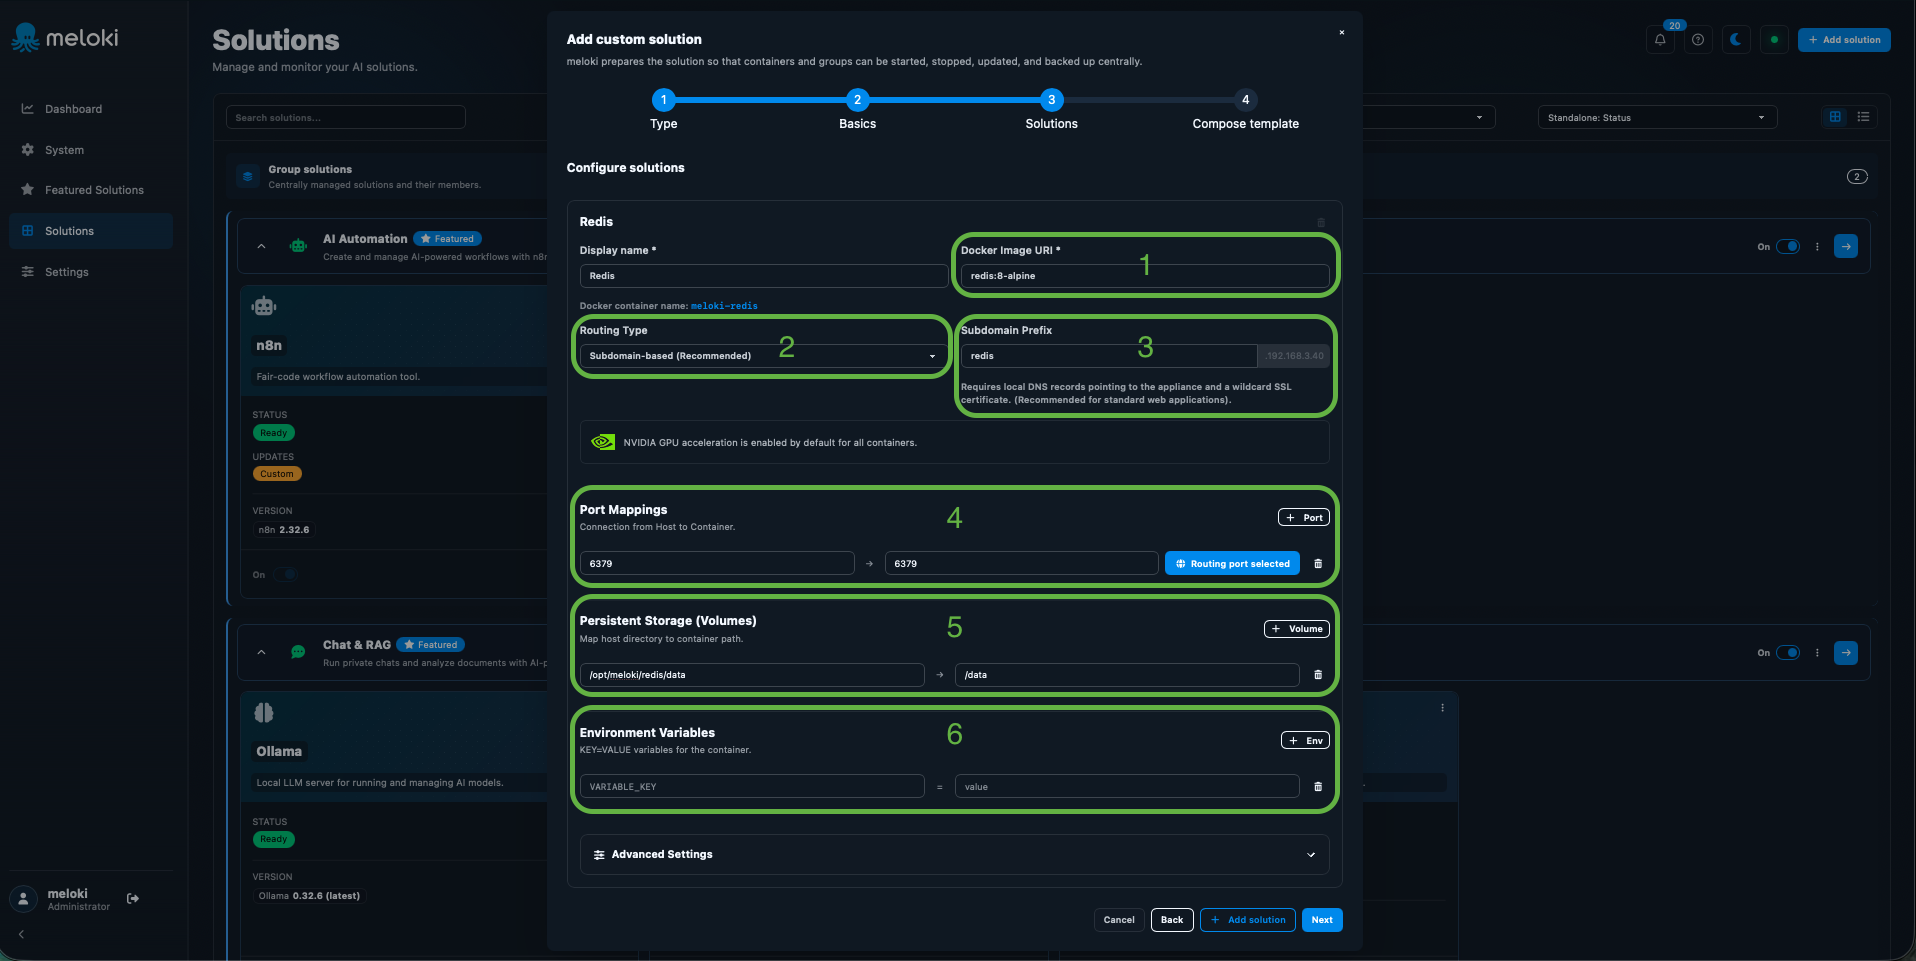
In this step, the technical settings for the container are defined.
1. Docker Image URI
Specify the Docker image to be used here, including the desired tag or version.
2. Routing Type
Determines how the application should be made accessible within the network—for example, via a subdomain.
3. Subdomain Prefix
For subdomain-based routing, enter the desired address prefix here.
4. Port Forwarding
Here, host ports can be mapped to the corresponding container ports.
5. Persistent Storage
Volumes allow you to map host directories to directories within the container. This ensures that important data is preserved even after the container is restarted or recreated.
6. Environment Variables
Additional key-value variables can be passed to the container here.
Use "Add Solution" to add further containers to the solution if needed.
Advanced Settings
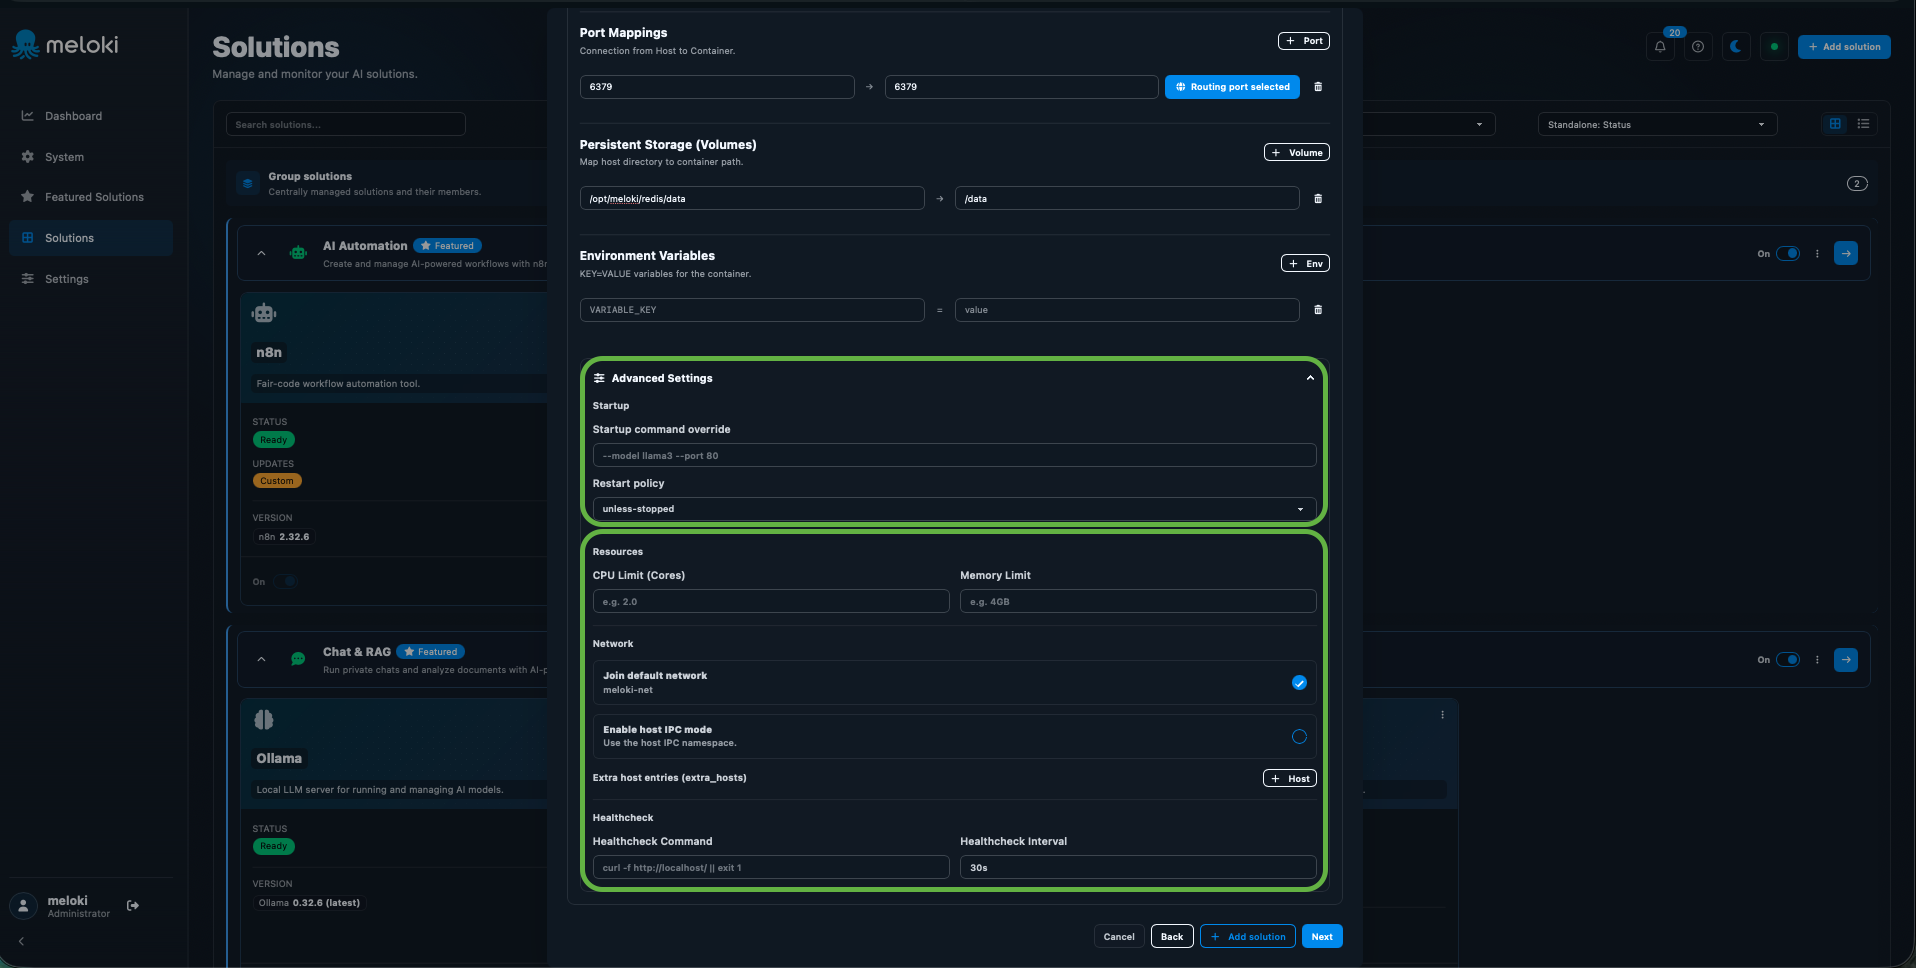
Additional options for container operation are available under "Advanced Settings".
Settings that can be configured include:
- Startup behavior and command overrides
- Restart policy for automatic restarts
- CPU and memory limits
- Network settings
- Host entries
- Health check for monitoring the container
These settings are primarily intended for customizing container behavior.
Compose template
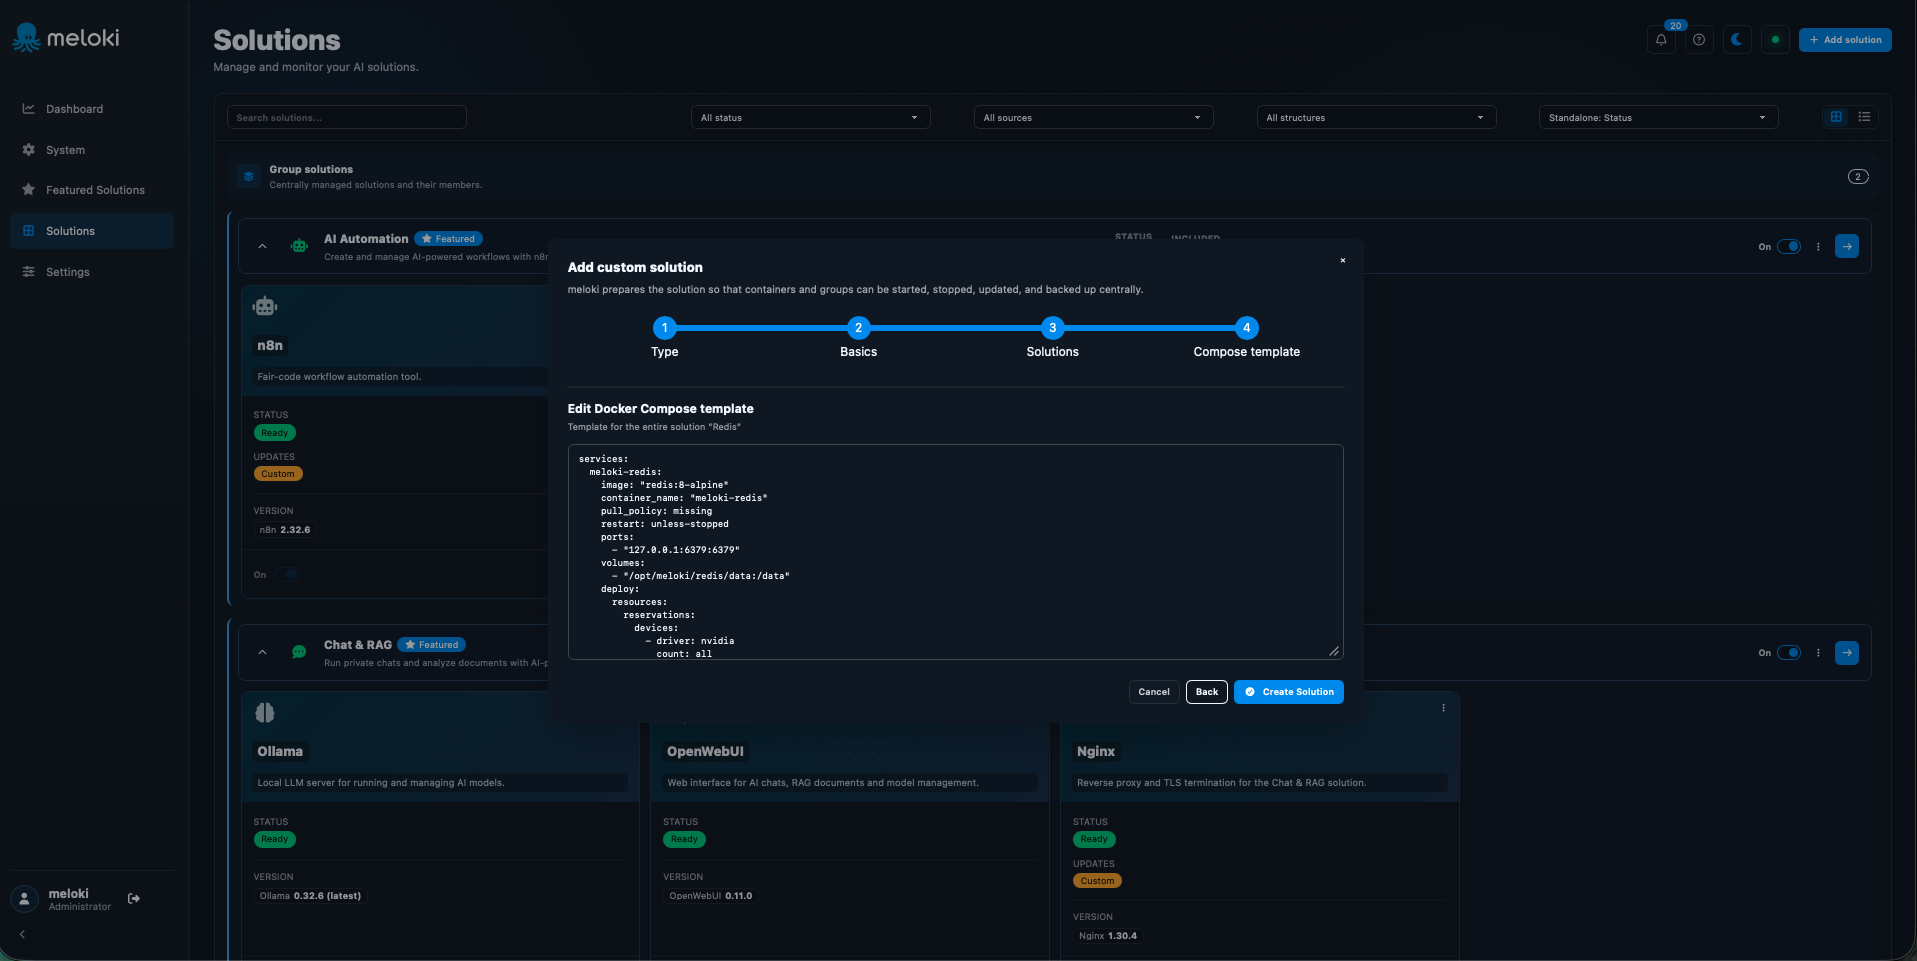
In the final step, the automatically generated Docker Compose template for the new solution is displayed.
The template contains the previously configured settings, such as:
- Docker image and container name
- Ports
- Volumes
- Restart policy
- Resources and other container settings
The Compose template can be reviewed and adjusted as needed before creation.
Clicking "Create solution" applies the configuration and creates the new solution in meloki.
Configuring Solutions
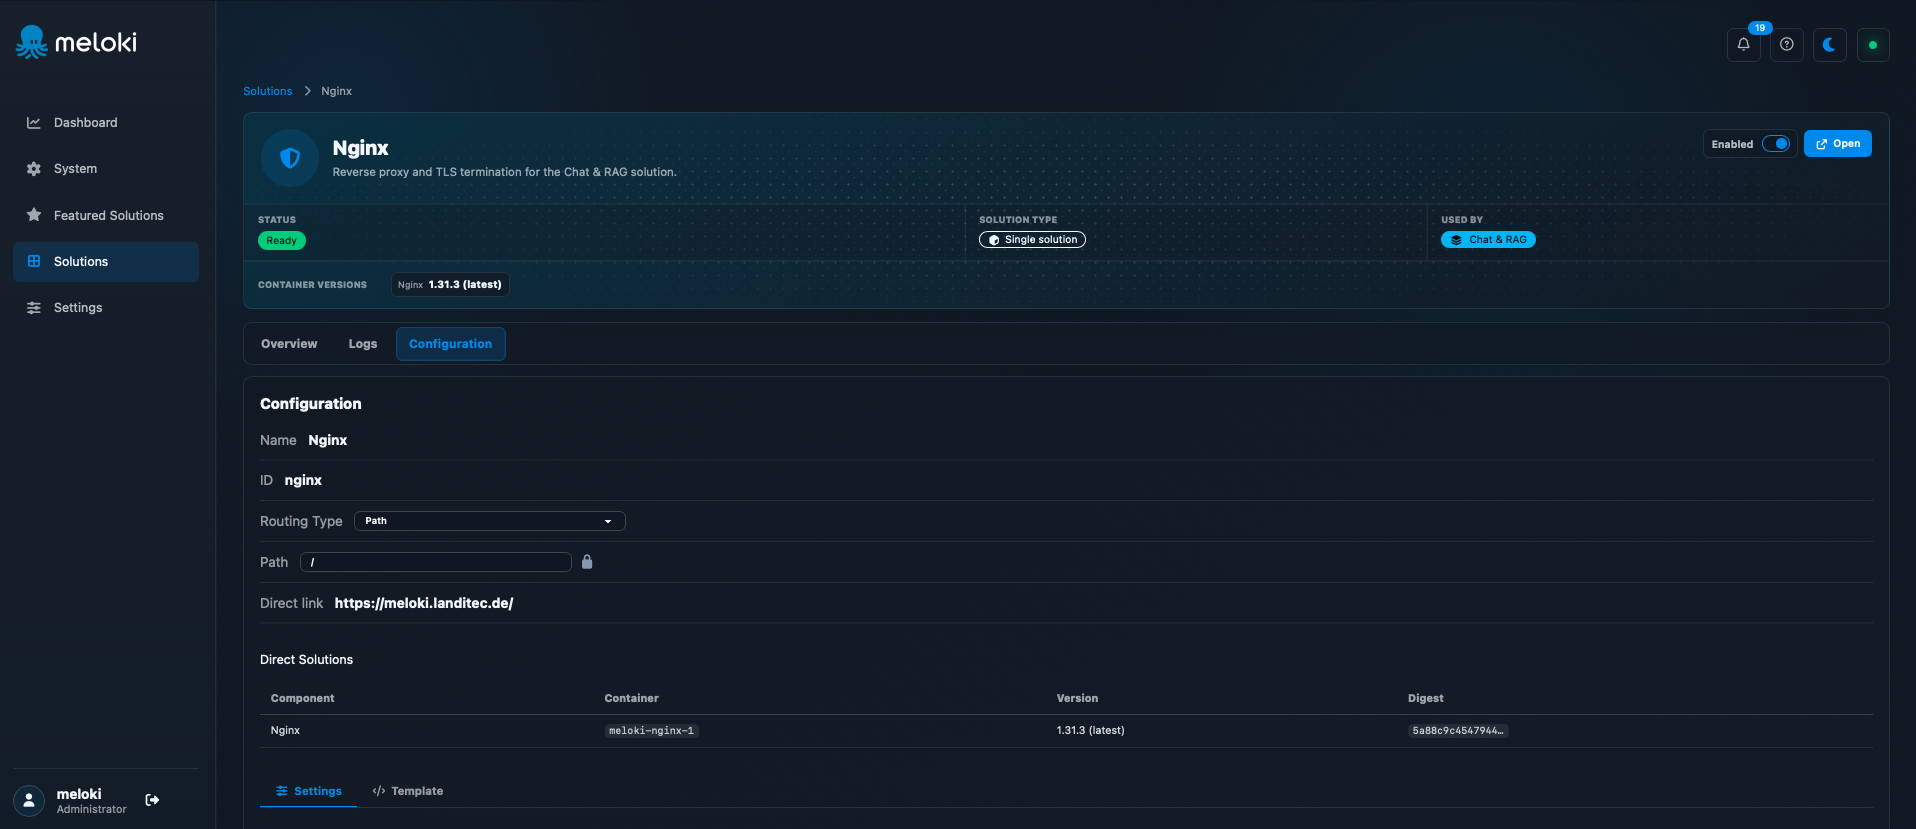
Changes can be made subsequently to the configurations of the respective solution.
This allows the routing type to be adjusted. However, some containers cannot be fully modified within the solution cluster.
The routing type determines the URL used to access an application or container:
Subdomain: The application is assigned its own subdomain.
Example: chat.meloki.landitec.de
A wildcard certificate, such as *.meloki.landitec.de, is advantageous here.
Path: The application is accessed via a specific path on the main domain.
Example: meloki.landitec.de/chat
Configuration Settings
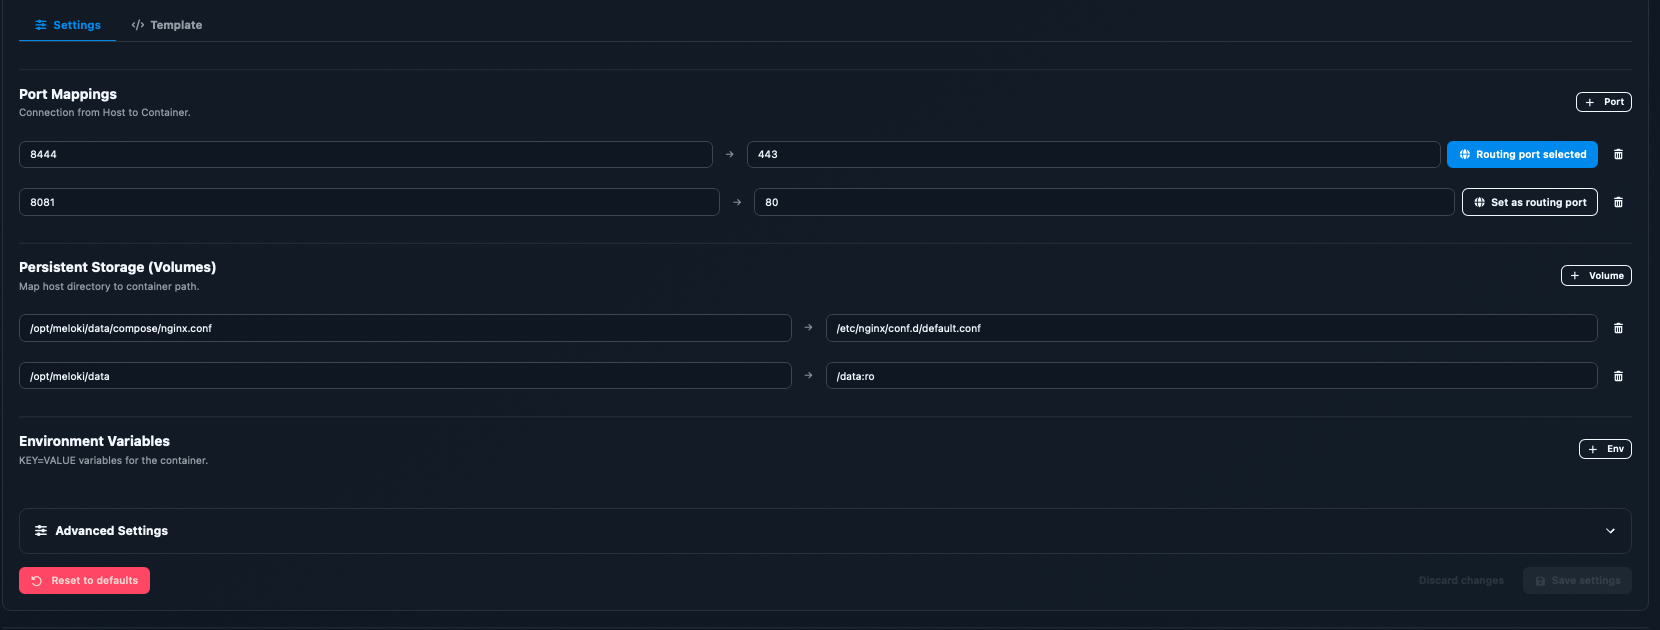
The Settings section allows you to adjust the container's basic configuration, including network access, storage, resources, and container behavior.
- Port Mappings: Here, host ports are mapped to the corresponding container ports. Additionally, a port can be designated as the routing port through which the service is accessed.
- Persistent Storage (Volumes): Host files or directories can be mounted into the container. This ensures that important data and configurations are preserved even after the container is restarted or recreated. Volumes can be mounted in read-only mode using
:ro. - Environment Variables: Additional configuration values—such as paths, URLs, or application-specific settings—can be passed to the container using the
KEY=VALUEformat. - Restart Policy: Determines how the container behaves after an error or restart. For example,
unless-stoppedensures the container automatically restarts unless it has been explicitly stopped. - Resources: The CPU Limit and Memory Limit settings define the maximum amount of CPU cores and memory the container is permitted to use.
- Host Entries: Additional hostname and IP mappings can be defined, allowing the container to access specific systems or services via a designated hostname.
- Healthcheck: A healthcheck allows for regular monitoring to ensure the service within the container is functioning correctly. This involves specifying a check command and the desired check interval.
- Save and Reset: Changes can be saved or discarded. There is also an option to revert the configuration to factory settings.
Configuration Template
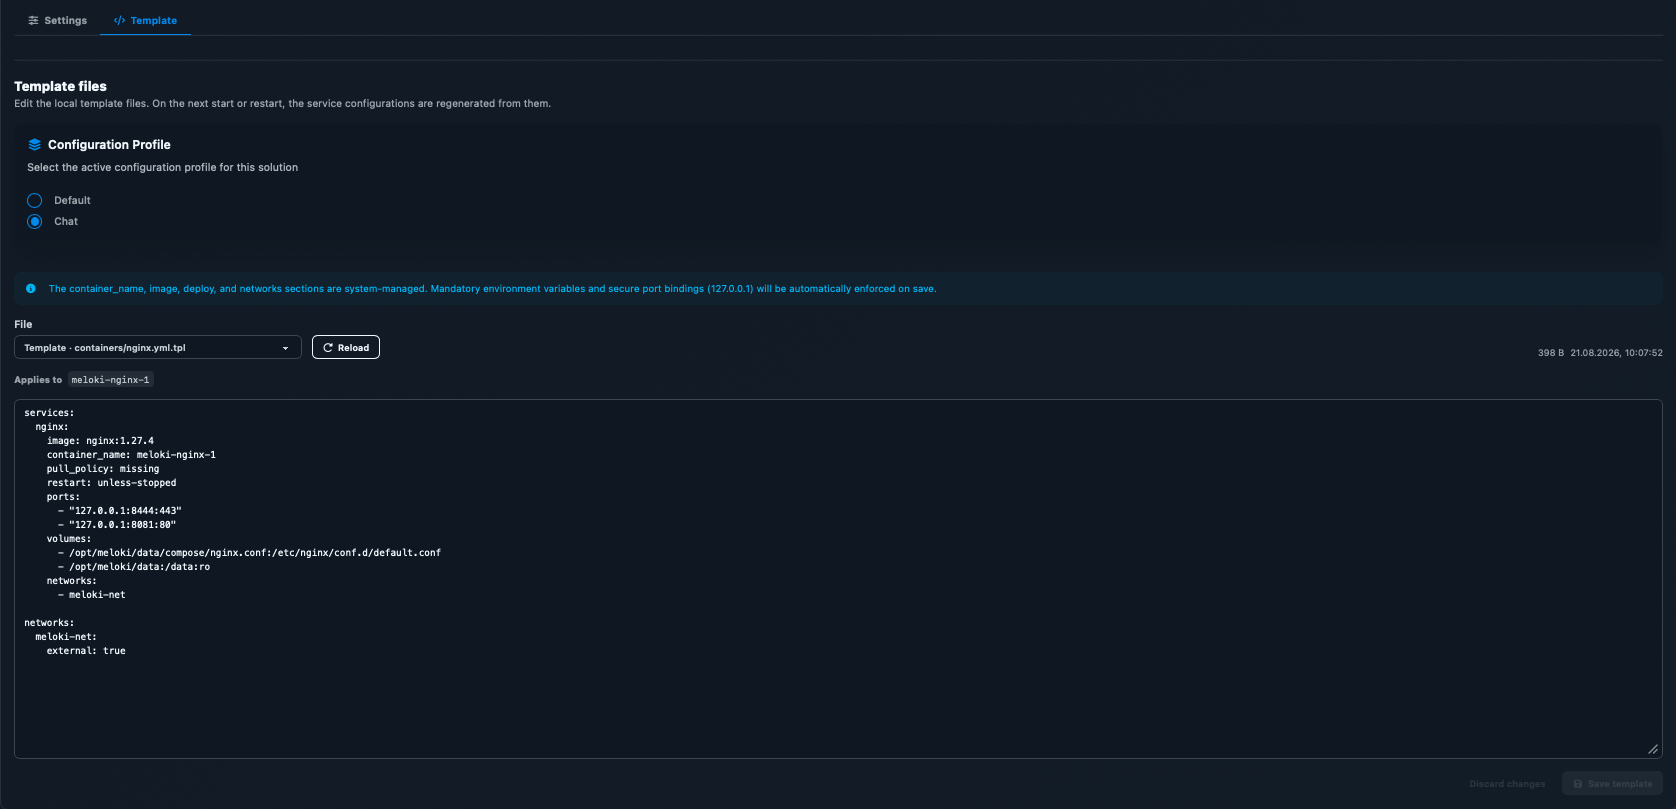
If CHAT & RAG is active, the NGINX template profile must always be set to CHAT.
In the Template section, the underlying container configuration can be edited directly. The settings are applied the next time the service starts or restarts.
- Configuration Profile: Selects the active profile, e.g.,
StandardorChat. Depending on the profile, the configuration is used either for Chat & Rag or for an NGINX function that excludes Chat & Rag. - Template File: Selects which template file is to be edited. The Reload function allows you to reload the current state of the file.
- Template Editor: Enables direct editing of the YAML configuration. This allows for the adjustment of settings that are not available via the standard interface.
- Container Configuration: The template defines elements such as the Docker image, restart behavior, port mappings, and volumes.
- Ports and Volumes: Ports determine the container's accessibility. Volumes specify which host files or directories are mounted into the container.
- Network: Defines the Docker network to which the container connects. The example uses the external network
meloki-net. - System-Managed Fields: Certain values—such as
container_name,image,deploy, andnetworks—are automatically managed by the system. - Save: Changes to the template can be saved and subsequently applied the next time the service starts or restarts.
Settings
General
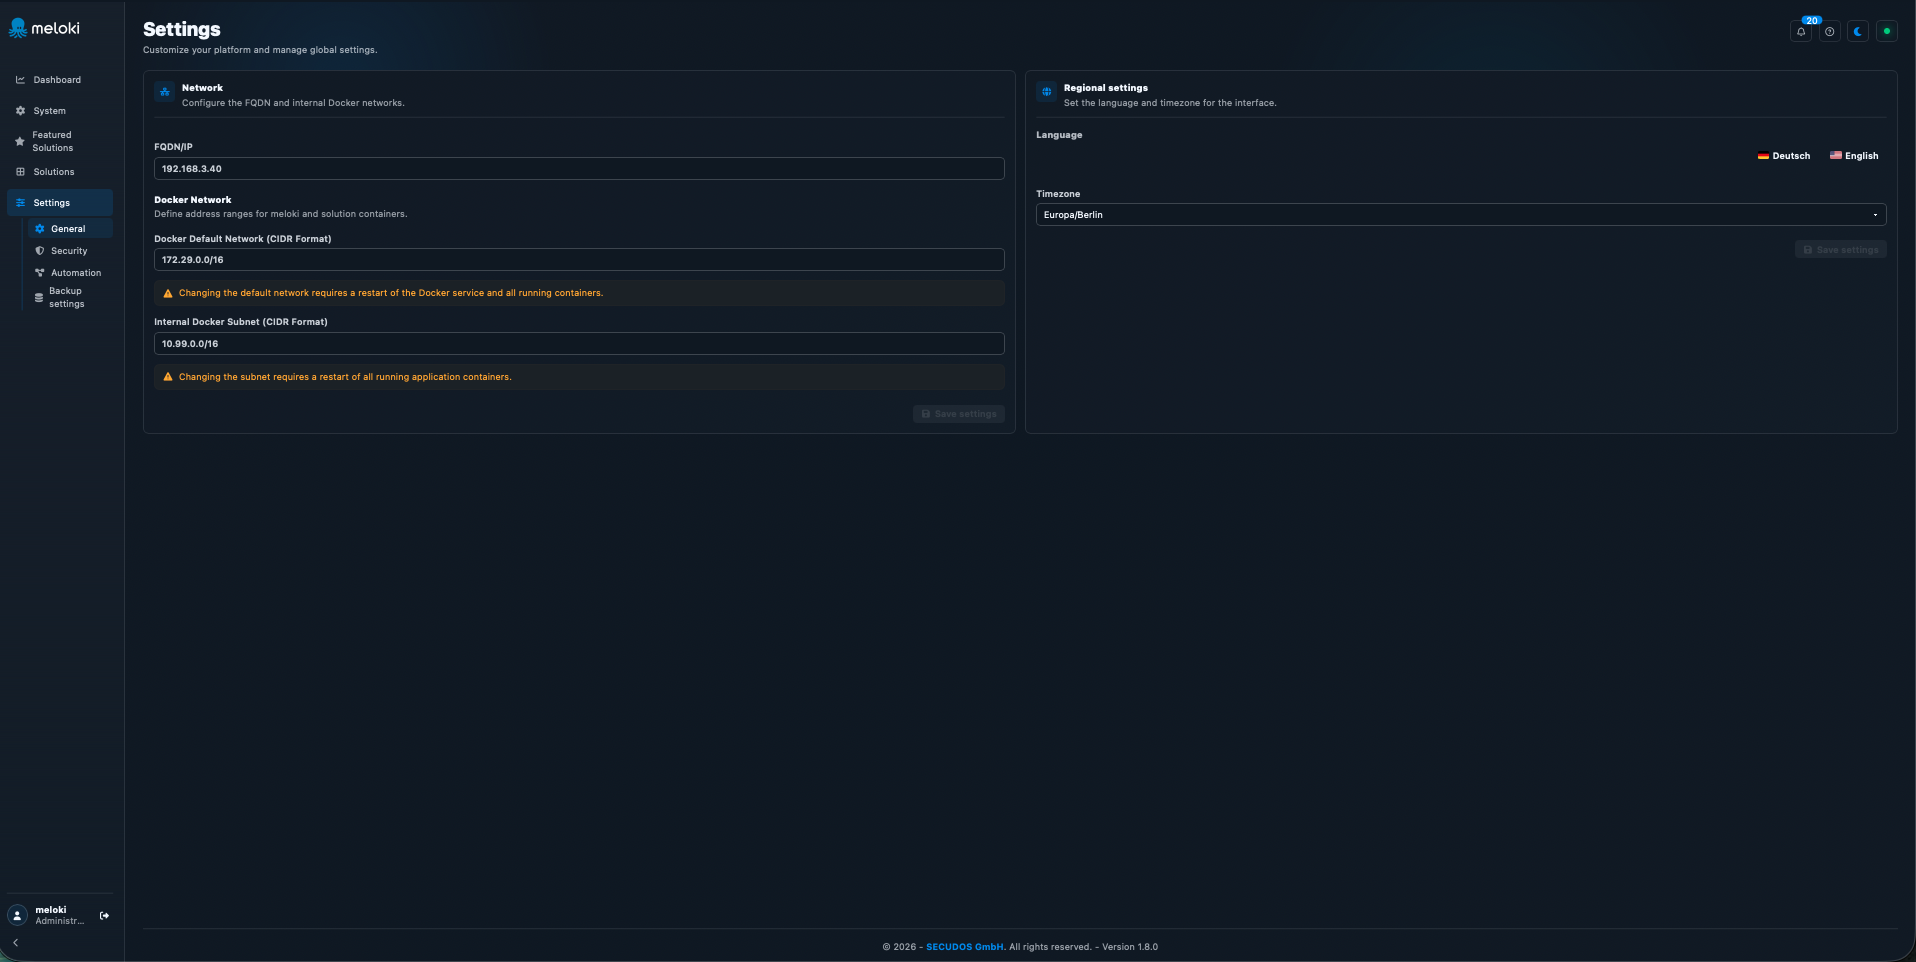
-
The General section is used to manage basic system and network settings.
-
Network
The following settings can be adjusted here:
- System FQDN or IP address
- Default Docker network
- Internal Docker subnet
Changes to the Docker networks may require the containers to be restarted.
- Local Settings
User interface settings can be adjusted here:
- Language – German or English
- Time zone – System time zone
It is possible to change the internal Docker network. Unless absolutely necessary, we advise against changing this network!
Security
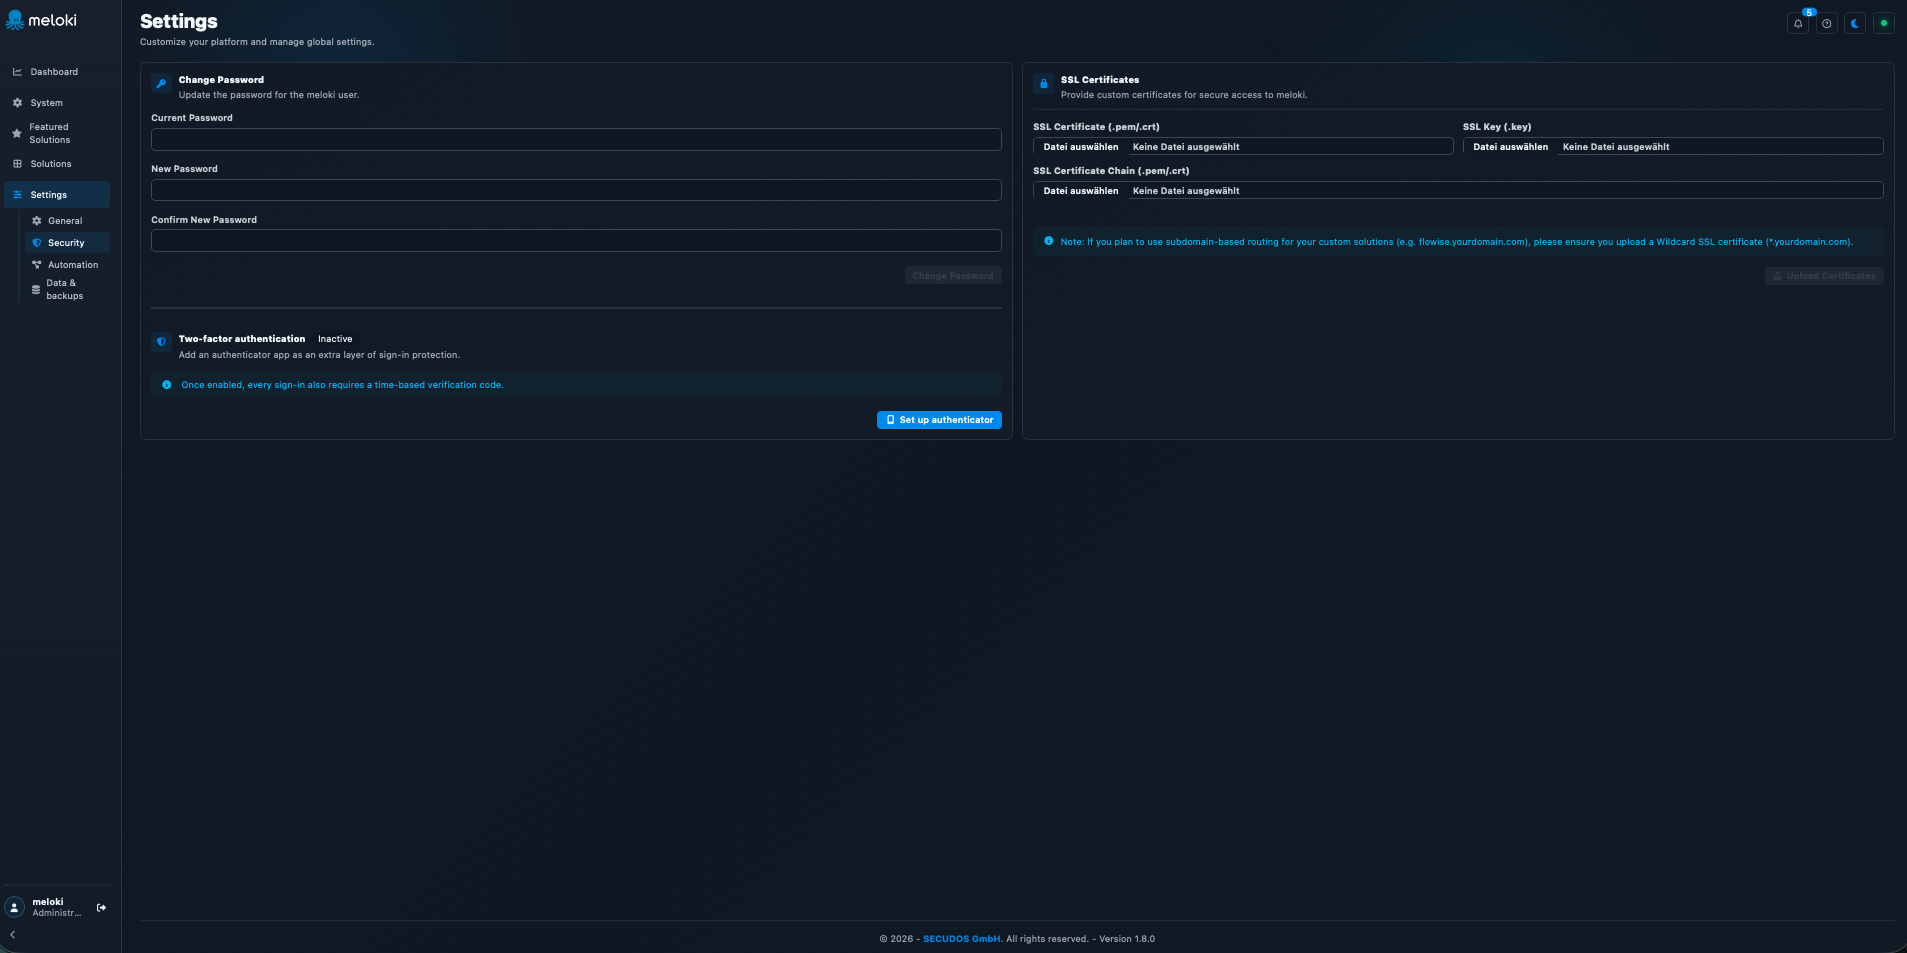
In the Security section, you can manage central security settings for meloki.
- Change password
Here, you can replace the current user password with a new one.
- Two-factor authentication
You can set up two-factor authentication (2FA) to add an extra layer of security to the login process using a time-based code.
- SSL certificates
Here, you can upload your own SSL certificates and keys to enable secure HTTPS access to meloki and the provided solutions.
Automation
Automate All Solutions
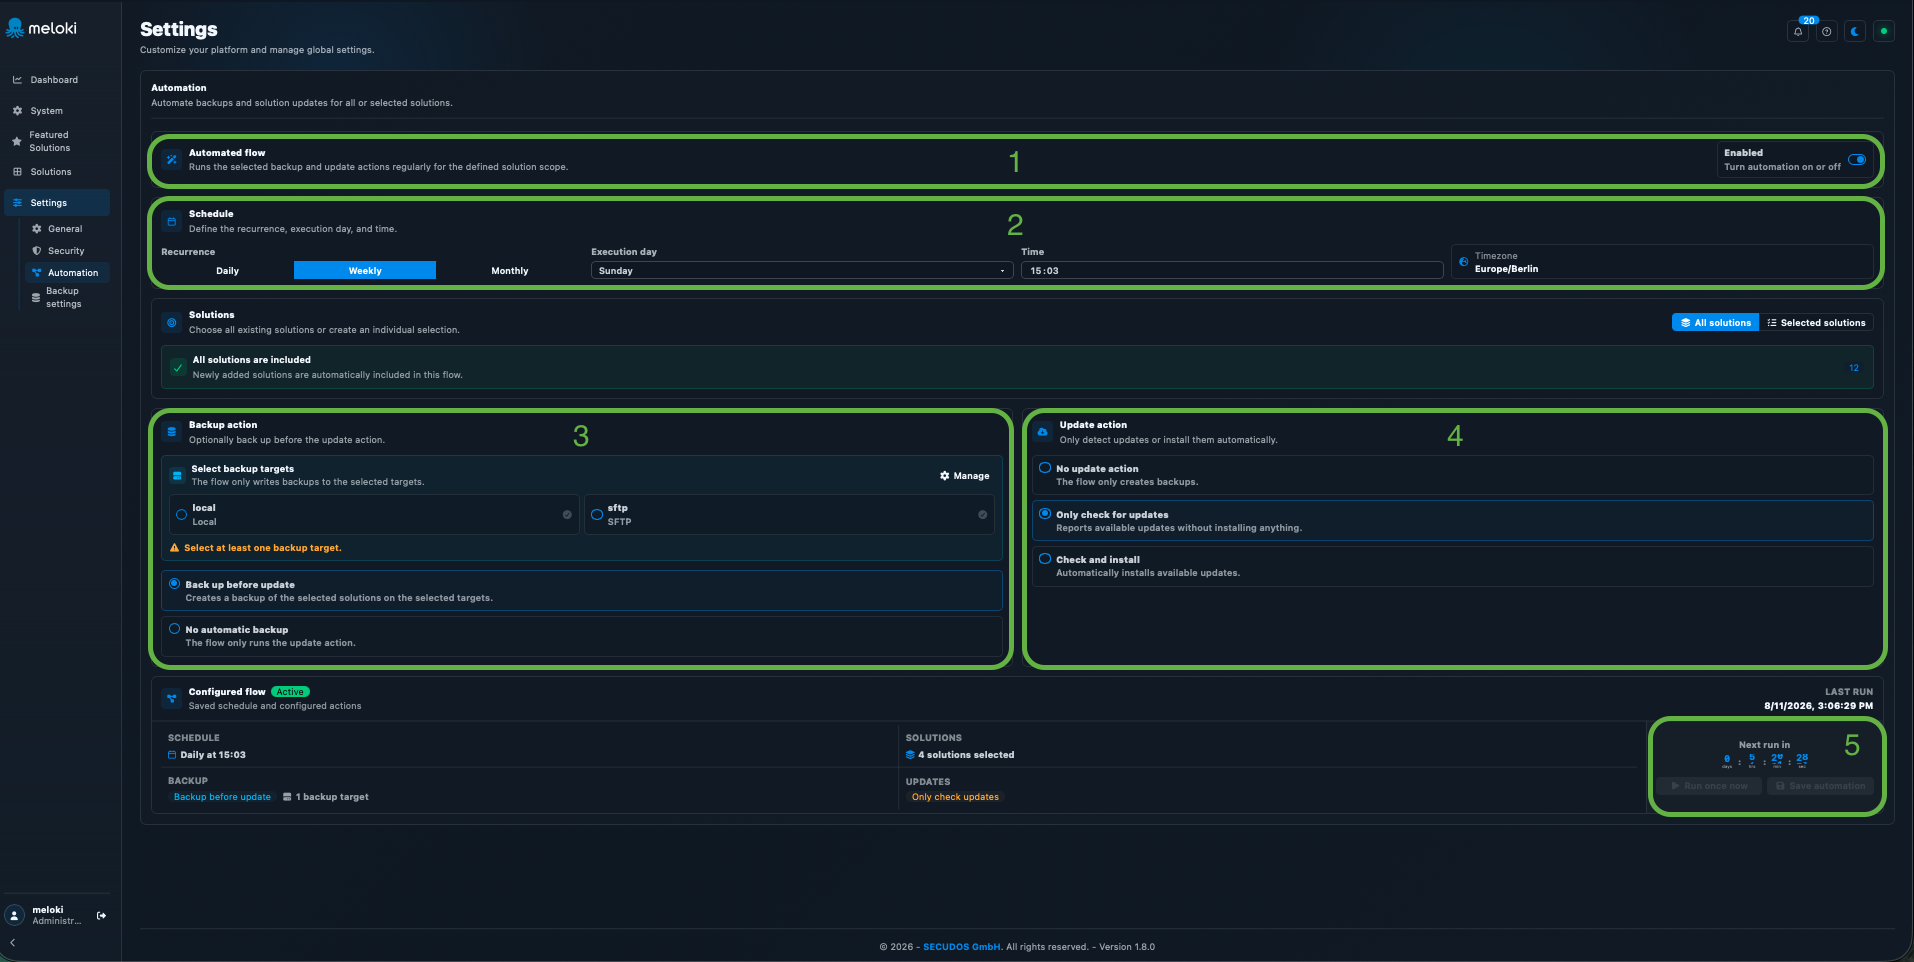
Here, you can schedule and execute automatic backups and updates for the existing solutions.
1. Automated Process
The configured automation can be centrally activated or deactivated here.
2. Schedule
This section defines when and how often the automation should run.
The following settings are available:
- Recurrence
- Day of execution
- Time
- Time zone
3. Backup Action
Specifies whether a backup should be created automatically before an update and determines the backup destination where it will be stored.
4. Update Action
Determines how updates should be handled:
- No update action
- Check for updates only
- Automatically install updates
5. Save / Run Automation
The configured automation can be saved or, if required, executed manually once.
Automation for Individual Solutions
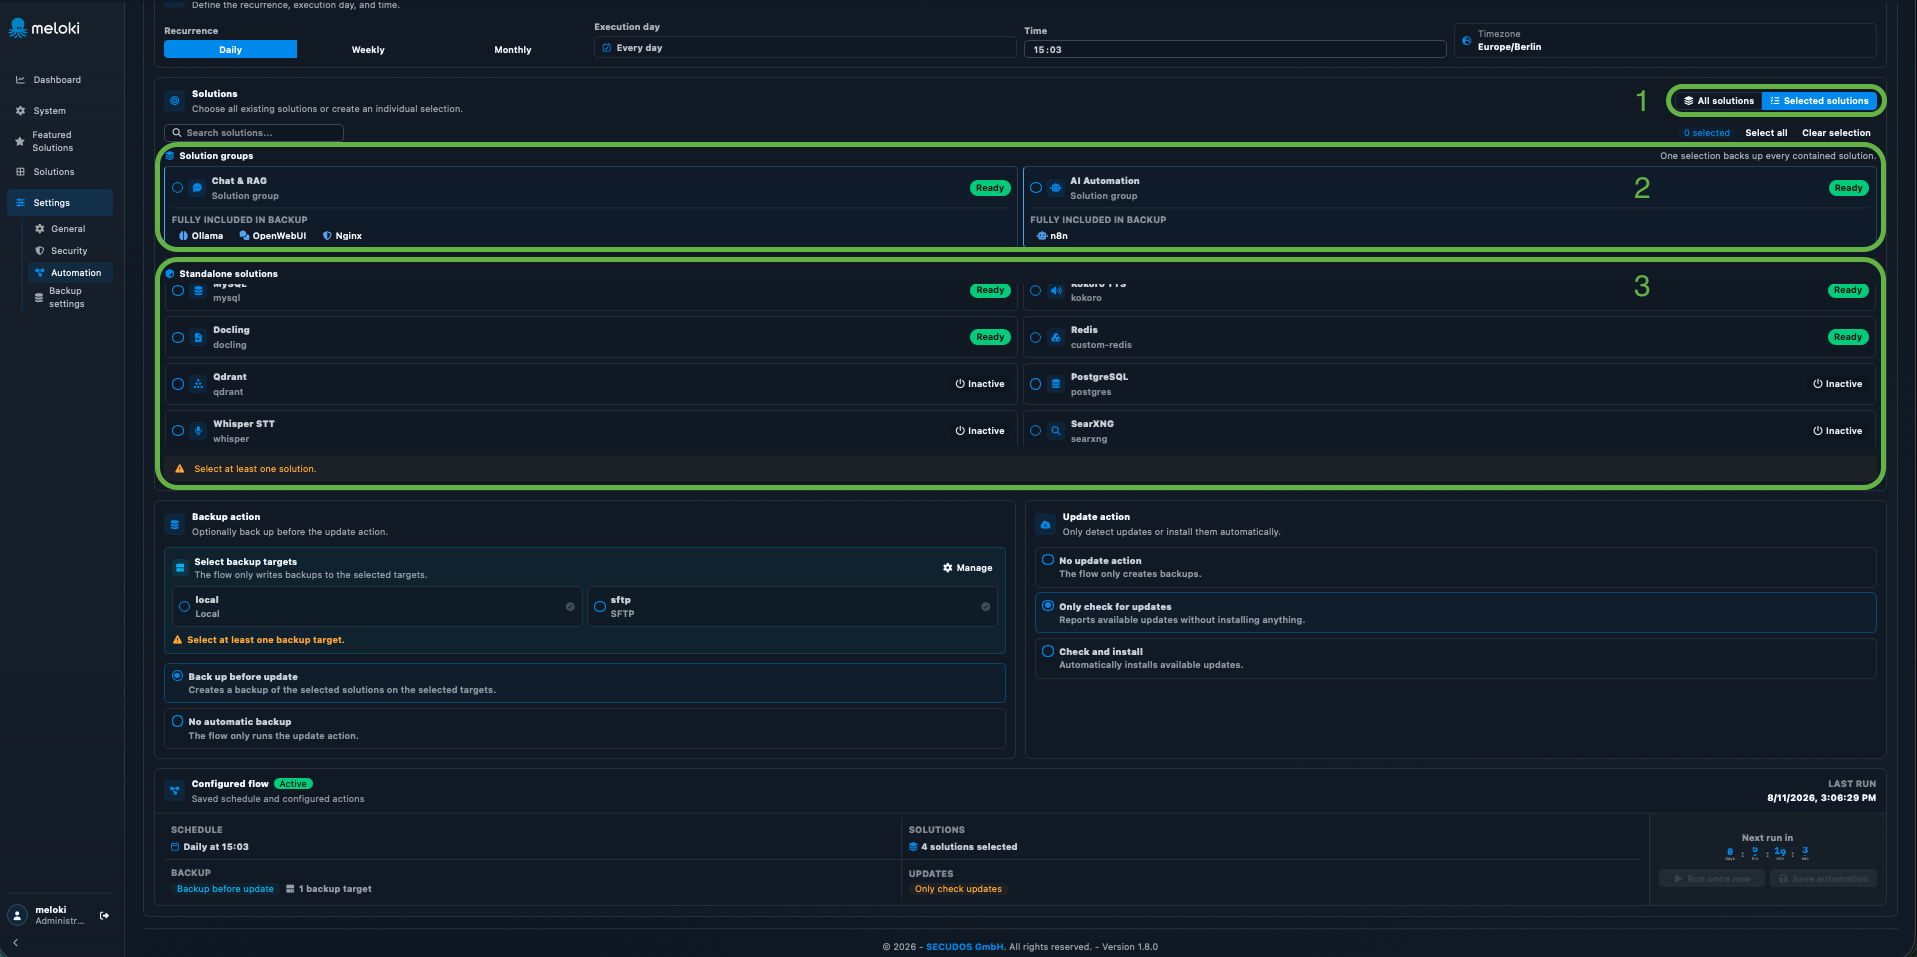
Here, you specify which solutions are included in the automated backup and update process.
1. Selection Mode
You can switch between all solutions and a custom selection.
2. Solution Groups
Here, you can select entire solution groups. All components contained within them are automatically included.
3. Standalone Solutions
Individual, independent solutions can be specifically selected for automation.
This allows you to precisely determine which applications should be automatically backed up or checked for updates.
Backup Settings
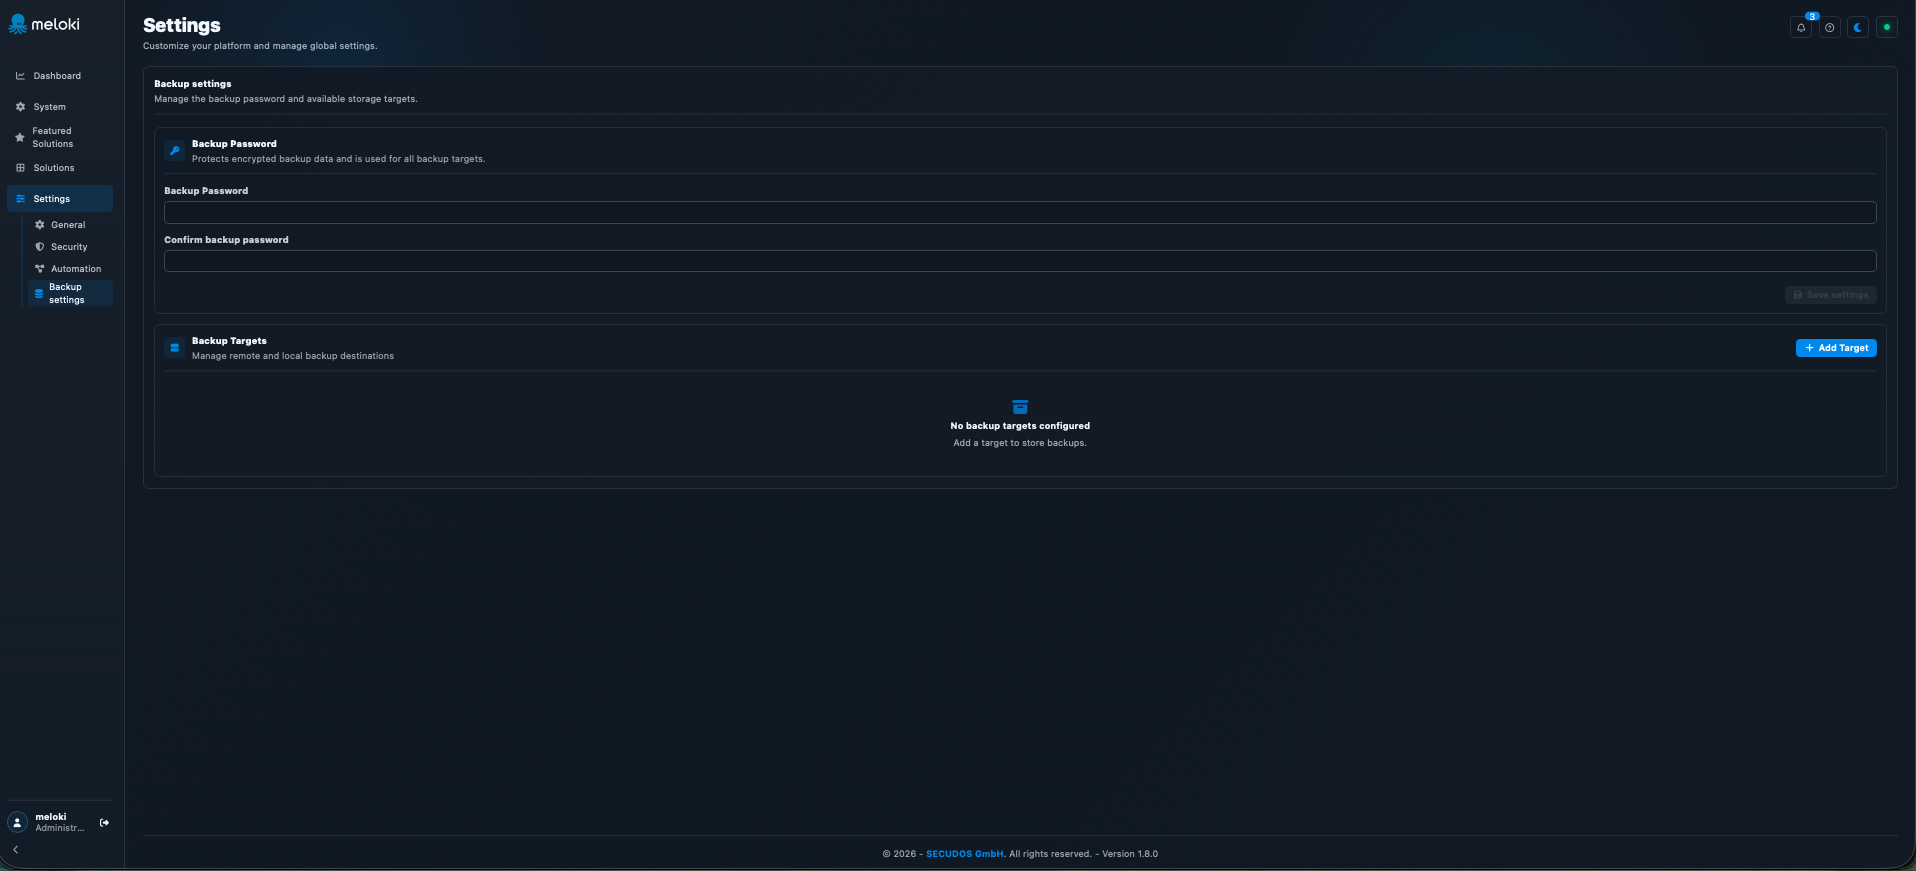
The backup password can be set up under Backup settings.
Please keep this password in a safe place. It is required if the system drive needs to be reinstalled and existing backups need to be restored.
Next, you can configure a backup destination.
Create Local Backup
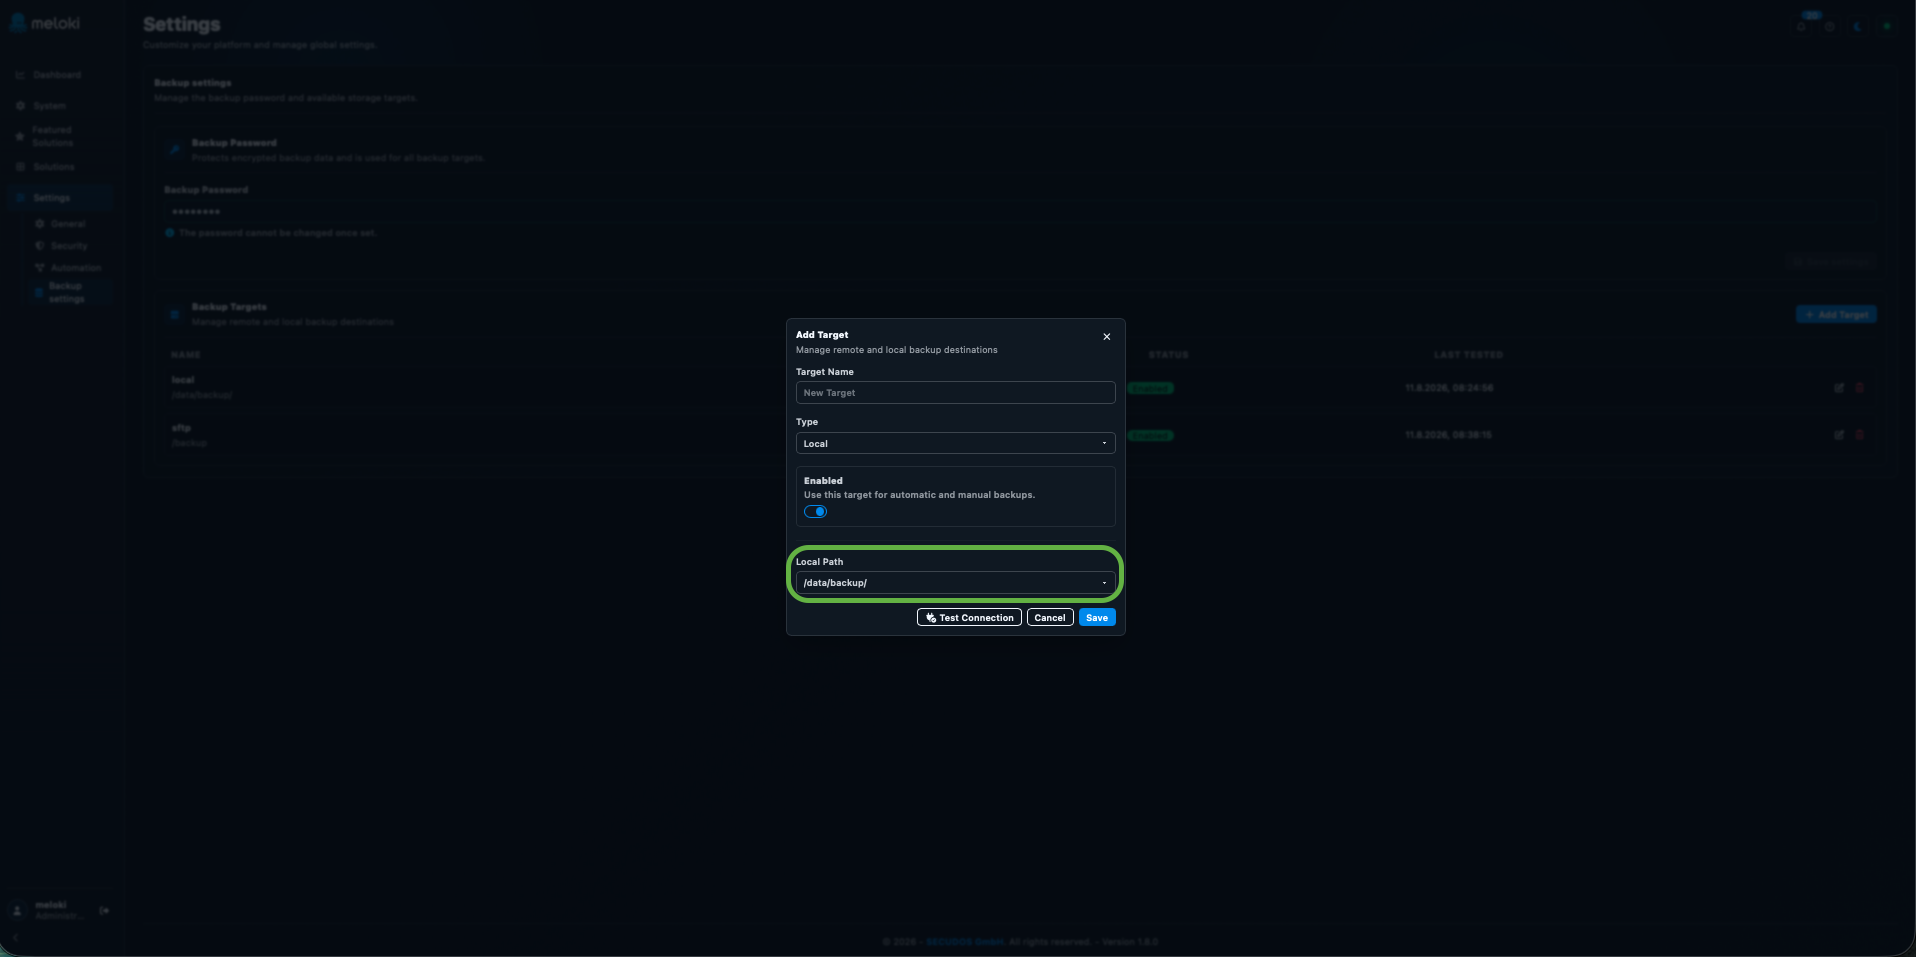
Here, you can set up a local storage location for backups.
- Specify the Destination Name and set the type to "Local".
- Activate the backup destination if necessary.
- Select the desired storage location under "Local Path".
- Optionally test the connection and then save.
Create SFTP Backup
SFTP Backup – Password
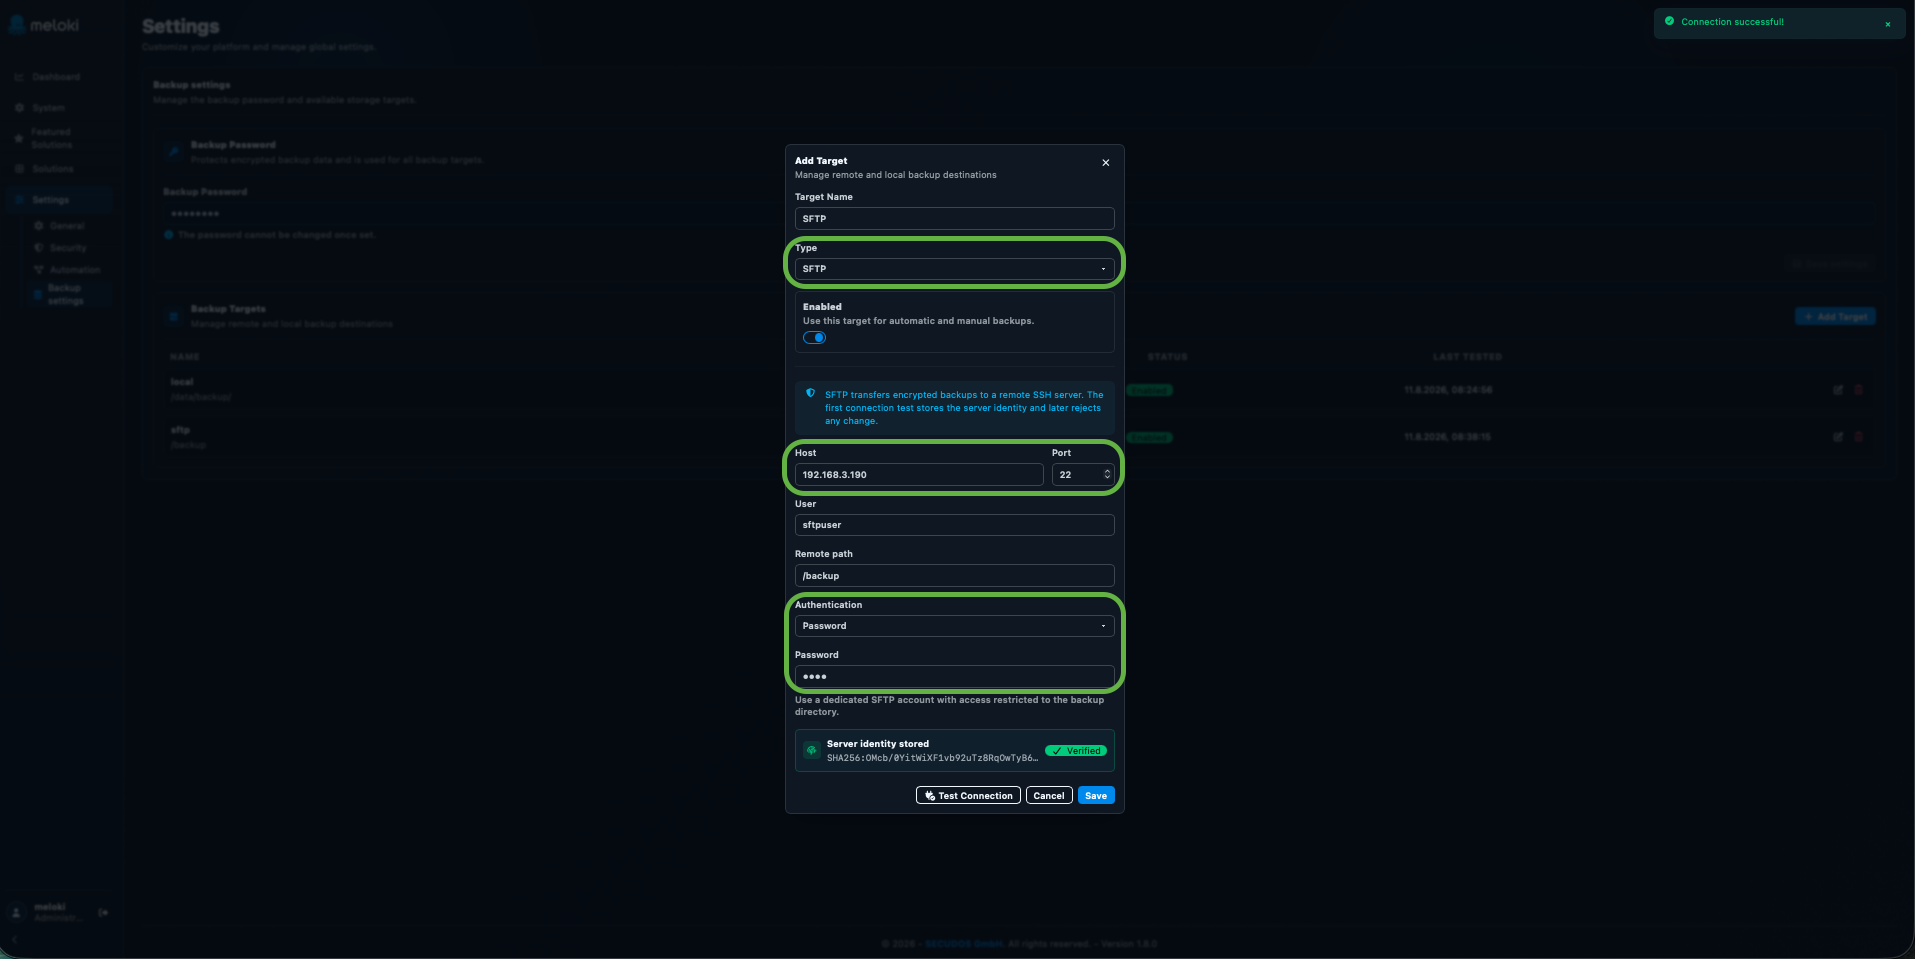
An external SFTP destination for backups can be set up here.
- Select SFTP as the type.
- Enter the host, port, user, and remote path.
- Select password as the authentication method and enter the password.
- Test the connection using "Test connection".
- Then save the backup destination.
SFTP Backup – SSH Key
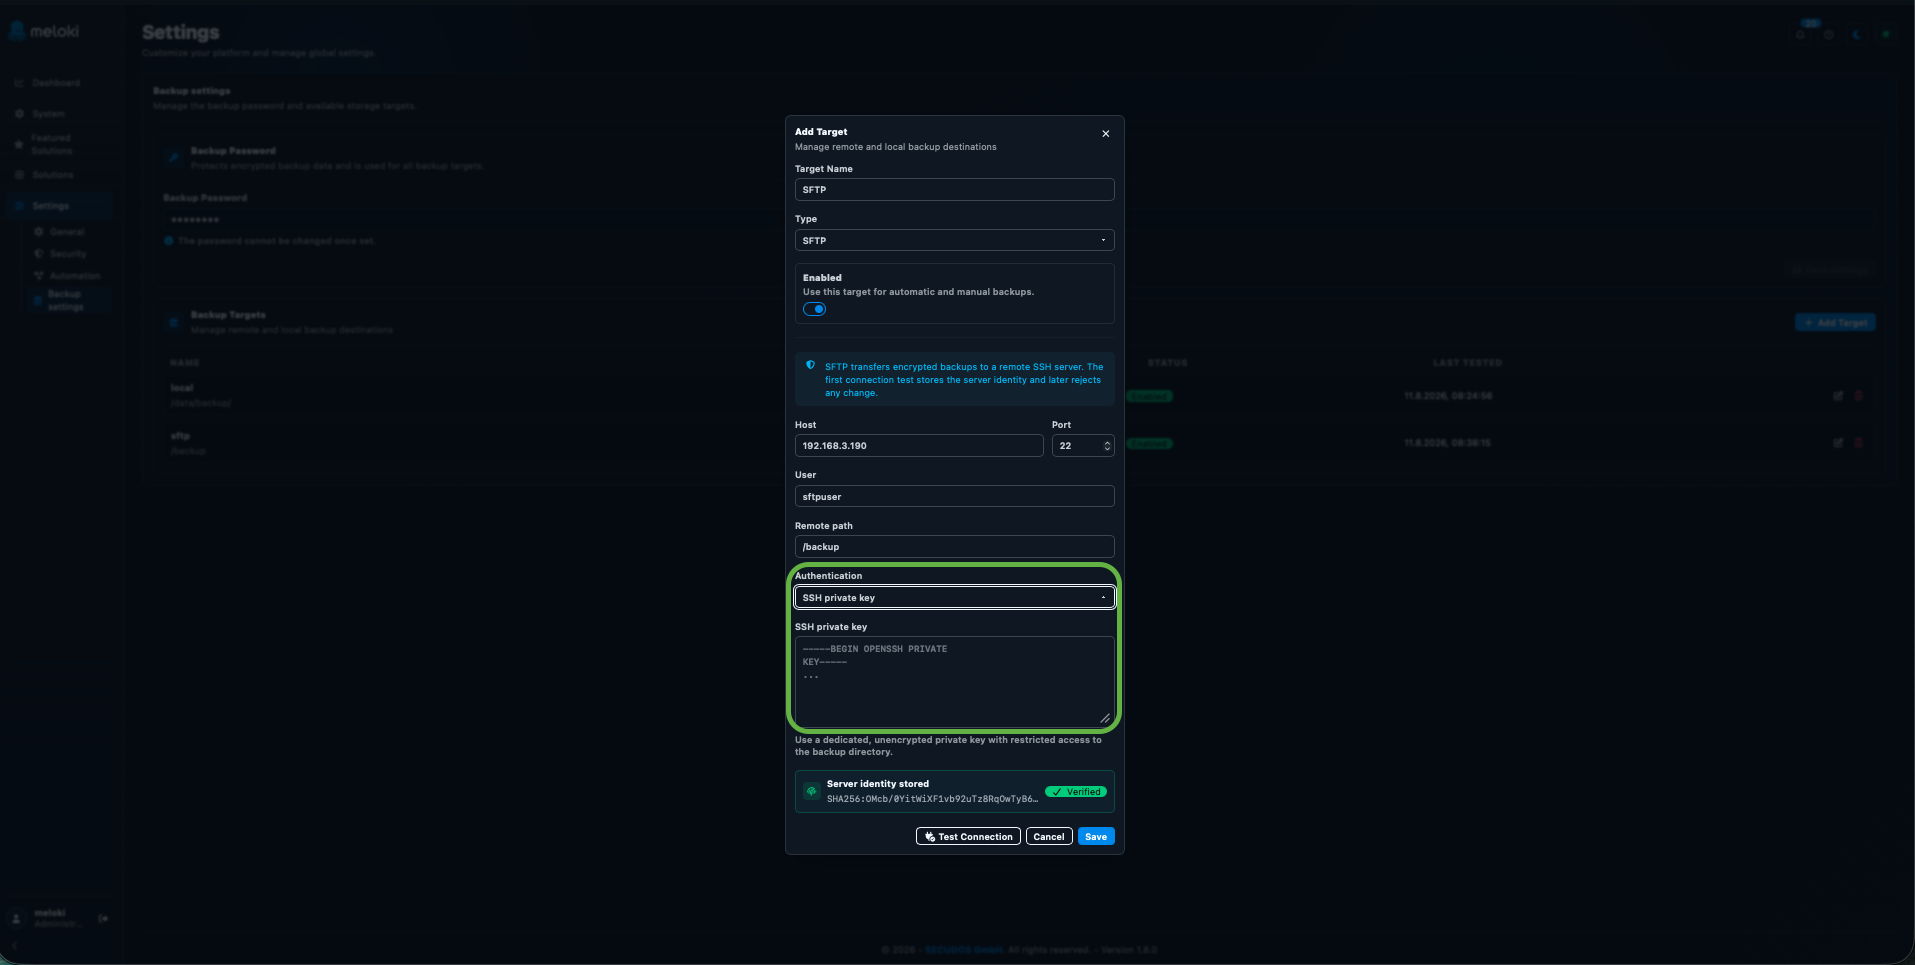
Alternatively, you can authenticate with the SFTP server using a private SSH key.
- Select private SSH key for authentication.
- Enter the private key in the designated field.
- Verify the connection using "Test connection".
- Once the check is successful, save the backup destination.